TOTAL VOLUME:
$134.2b
24H VOL:
$134,145,987
24H TRANSACTIONS:
2,388,728,490
OPEN INTEREST:
$1,441,166,947
406,422
Markets across
30,383
events
MATCHED EVENTS:
2,688
PLATFORM COVERAGE:
5
Polymarket:
39%
VS.
Kalshi:
61%
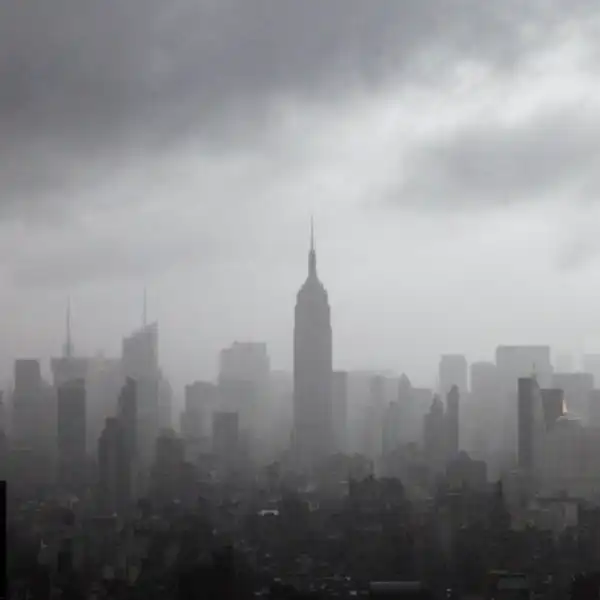
Rain in NYC
- Kalshi
Rain in NYC - Kalshi
1W
News
Positive
Negative
Neutral
Hover marker for details
Vol.
·
Resolved Jun 27, 2026
Latest in Climate and Weather


Closed: Jun 26, 11:59 PM EST

Kalshi
Description
This event concerns whether rainfall will occur in Central Park, New York on June 26, 2026. The outcome depends on whether any measurable precipitation is recorded at that specific location on that date.
Kalshi
If the number of inches of precipitation recorded at Central Park, New York on June 26, 2026 is strictly greater than 0, then the market resolves to Yes.
Frequently asked questions
Prediction market odds often diverge from traditional weather forecasts because they incorporate real-time trader behavior, financial incentives, and a broader range of information sources. While meteorologists issue probabilistic forecasts based on atmospheric models, this market aggregates the beliefs of many participants with money at stake, which can surface insights that models alone might miss. Comparing the current odds to the National Weather Service or other official forecasts can reveal where the market is pricing in additional uncertainty or confidence. Over time, prediction markets have demonstrated competitive accuracy against expert predictions, particularly when liquidity and participation are robust.
On Kalshi, this market is priced through a continuous order book where traders submit bids and asks for Yes and No shares. On Kalshi, prices reflect that venue's order book, liquidity, and how traders price the outcome right now. The price of each outcome ranges from 0 to 100 cents, representing the implied probability that it will rain in NYC on June 26, 2026. As traders buy and sell, the price adjusts in real time to reflect supply and demand. Higher prices indicate stronger market belief in rain; lower prices suggest traders expect dry conditions. This mechanism ensures that the market price always reflects the most up-to-date consensus among active participants.
This market resolves around Jun 27, 2026, after June 26, 2026 has passed. The outcome is determined by verifying whether measurable precipitation fell in New York City on that date, confirmed through credible public weather reporting and historical records. Once the event is verifiable, the market settles automatically: traders holding Yes shares receive their payout if rain occurred, while No shareholders are paid if the day remained dry. The resolution process is designed to be objective and transparent, removing ambiguity about how the market will close.
Several factors can shift odds in this market over the coming months. Major weather pattern changes—such as shifts in the jet stream, tropical system development, or seasonal climate anomalies—often trigger significant repricing. Updated seasonal forecasts from meteorological agencies, historical rainfall data for late June in NYC, and real-time atmospheric model runs all influence trader sentiment. As June 2026 approaches, short-range forecasts become more reliable and typically drive larger price swings. Breaking news about climate events or unusual weather patterns can also prompt rapid trading. Traders who monitor long-range forecasts and seasonal trends early may identify opportunities before the broader market reacts.
'%3e%3ccircle%20cx='26'%20cy='26'%20r='26'%20fill='%23000'/%3e%3cpath%20fill='%23fff'%20d='M27.6629%2037.9855L31.004%2037.6925L32.1989%2051.3689C33.72%2051.027%2035.2073%2050.5486%2036.6425%2049.9395V37.8085H40.7697V47.7178C42.4942%2046.577%2044.0775%2045.236%2045.4865%2043.7226L46.0172%2037.6591L49.5548%2037.9678C51.5707%2034.0725%2052.5697%2029.7306%2052.4591%2025.3456C52.3484%2020.9605%2051.1317%2016.6746%2048.9219%2012.886L48.7903%2014.392L44.6631%2014.0303L45.1937%207.97067C43.8569%206.58147%2042.3706%205.34447%2040.7619%204.28222V14.2406H36.6347V2.06247C34.8743%201.313%2033.0358%200.762345%2031.1533%200.420753L32.3463%2014.0637L29.0052%2014.3566L27.7513%200.0314647C27.3308%200.0118035%2026.9062%200%2026.4817%200C24.8262%204.44017e-06%2023.1745%200.157349%2021.5487%200.469906L23.9072%2013.8985L21.364%2014.3468L19.0253%201.0853C16.8454%201.73668%2014.7611%202.67345%2012.8266%203.87129L15.4601%2013.7019L13.4634%2014.2387L11.0146%205.09226C9.12509%206.49278%207.43337%208.1422%205.98527%209.99577L7.26077%2013.5014L5.80446%2014.0322L4.88665%2011.5097C3.41845%2013.6953%202.29182%2016.092%201.54558%2018.6172L1.95829%2018.4678L7.2647%2033.0387L5.80839%2033.5696L1.06407%2020.5303C-0.0225105%2025.6016%200.430464%2030.8821%202.36486%2035.6941C4.29926%2040.5061%207.62683%2044.6301%2011.9206%2047.5369L9.45605%2038.3355L11.4528%2037.7987L14.4677%2049.0567C16.5333%2050.1354%2018.7355%2050.9291%2021.0142%2051.4161L18.6892%2038.1605L21.2343%2037.7122L23.7283%2051.8683C24.6462%2051.9654%2025.5686%2052.014%2026.4916%2052.0138C27.2954%2052.0138%2028.0933%2051.9764%2028.8795%2051.9037L27.6629%2037.9855Z'%20/%3e%3cpath%20fill='%23000'%20d='M46.0368%2018.1276L50.1542%2018.4875L48.804%2033.9372L44.6768%2033.5774L46.0368%2018.1276ZM36.6484%2018.279H40.7756V33.7858H36.6484V18.279ZM31.0099%2018.1611L32.3601%2033.6109L29.019%2033.9038L27.6668%2018.454L31.0099%2018.1611ZM13.481%2033.7898L9.4698%2018.8099L11.4666%2018.2751L15.4778%2033.2452L13.481%2033.7898ZM21.3817%2033.892L18.6892%2018.6211L21.2343%2018.1729L23.9248%2033.4418L21.3817%2033.892Z'%20/%3e%3c/g%3e%3c/svg%3e)

