TOTAL VOLUME:
$134b
24H VOL:
$107,351,958
24H TRANSACTIONS:
2,388,728,490
OPEN INTEREST:
$1,416,970,024
400,720
Markets across
30,097
events
MATCHED EVENTS:
2,633
PLATFORM COVERAGE:
5
Polymarket:
39%
VS.
Kalshi:
61%
58° to 59°
- Kalshi
58° to 59° - Kalshi
1W
News
Positive
Negative
Neutral
Hover marker for details
Vol.
·
Resolved Jun 8, 2026
Latest in Climate and Weather


Closed: Jun 8, 3:00 AM EST

Kalshi
Description
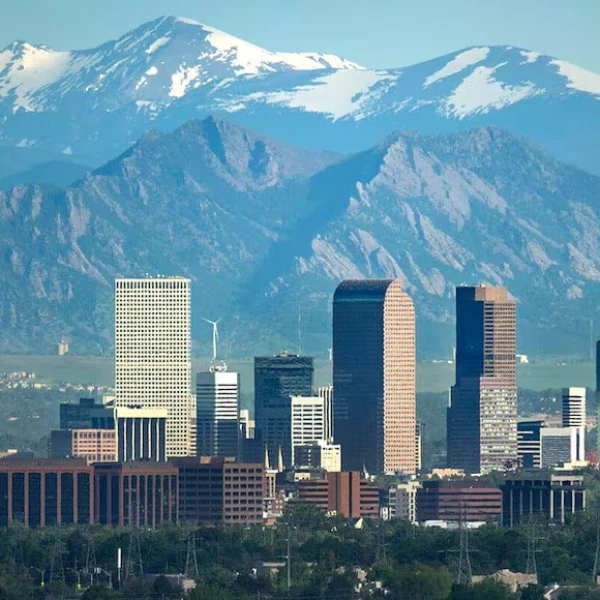
The minimum temperature in Denver on June 7, 2026, will be recorded by the National Weather Service and categorized within a specified range.
Frequently asked questions
Prediction market odds on Kalshi represent real-money bets from traders and often diverge from traditional meteorological forecasts. While weather analysts rely on numerical models and historical data to project June temperatures in Denver, prediction markets incorporate trader expectations, recent climate patterns, and broader sentiment. Comparing the market's implied probability to official National Weather Service or climate analyst predictions can reveal whether traders are pricing in more extreme or more moderate outcomes. This comparison highlights how financial incentives and collective intelligence shape market-based weather forecasting.
On Kalshi, prices reflect that venue's order book, liquidity, and how traders price the outcome right now. On Kalshi, the lowest temperature in Denver on June 7, 2026 is priced as binary or range-based contracts, where each outcome represents a specific temperature threshold or band. Traders buy and sell shares at prices reflecting the probability of that outcome occurring. The market price directly translates to implied odds; for example, a contract trading at 0.65 implies a 65 percent chance. As new information emerges—such as seasonal forecasts or atmospheric patterns—prices adjust to reflect updated trader conviction, allowing you to enter or exit positions at any time before market close on Jun 8, 2026.
The market resolves on Jun 8, 2026, after the close of trading and once the official lowest temperature for Denver on June 7, 2026 is recorded. The outcome is determined by verified meteorological data for that specific date. Traders holding shares in the correct outcome receive their payout, while incorrect positions expire worthless. The resolution window ensures sufficient time for data confirmation and settlement processing on Kalshi. Mark your calendar to monitor forecasts and market movement in the final hours before expiration.
Several factors could shift odds for Denver's lowest temperature on June 7, 2026. Major weather pattern changes—such as a cold front moving into the region or an unexpected heat dome—would trigger significant repricing. Seasonal climate forecasts released by NOAA or other meteorological agencies could influence trader expectations. Long-range model updates in the weeks leading up to June will refine predictions and move prices. Additionally, broader climate anomalies, El Niño or La Niña conditions, and historical temperature comparisons may prompt traders to adjust their positions. Monitor weather news and forecast updates closely as the date approaches.
'%3e%3ccircle%20cx='26'%20cy='26'%20r='26'%20fill='%23000'/%3e%3cpath%20fill='%23fff'%20d='M27.6629%2037.9855L31.004%2037.6925L32.1989%2051.3689C33.72%2051.027%2035.2073%2050.5486%2036.6425%2049.9395V37.8085H40.7697V47.7178C42.4942%2046.577%2044.0775%2045.236%2045.4865%2043.7226L46.0172%2037.6591L49.5548%2037.9678C51.5707%2034.0725%2052.5697%2029.7306%2052.4591%2025.3456C52.3484%2020.9605%2051.1317%2016.6746%2048.9219%2012.886L48.7903%2014.392L44.6631%2014.0303L45.1937%207.97067C43.8569%206.58147%2042.3706%205.34447%2040.7619%204.28222V14.2406H36.6347V2.06247C34.8743%201.313%2033.0358%200.762345%2031.1533%200.420753L32.3463%2014.0637L29.0052%2014.3566L27.7513%200.0314647C27.3308%200.0118035%2026.9062%200%2026.4817%200C24.8262%204.44017e-06%2023.1745%200.157349%2021.5487%200.469906L23.9072%2013.8985L21.364%2014.3468L19.0253%201.0853C16.8454%201.73668%2014.7611%202.67345%2012.8266%203.87129L15.4601%2013.7019L13.4634%2014.2387L11.0146%205.09226C9.12509%206.49278%207.43337%208.1422%205.98527%209.99577L7.26077%2013.5014L5.80446%2014.0322L4.88665%2011.5097C3.41845%2013.6953%202.29182%2016.092%201.54558%2018.6172L1.95829%2018.4678L7.2647%2033.0387L5.80839%2033.5696L1.06407%2020.5303C-0.0225105%2025.6016%200.430464%2030.8821%202.36486%2035.6941C4.29926%2040.5061%207.62683%2044.6301%2011.9206%2047.5369L9.45605%2038.3355L11.4528%2037.7987L14.4677%2049.0567C16.5333%2050.1354%2018.7355%2050.9291%2021.0142%2051.4161L18.6892%2038.1605L21.2343%2037.7122L23.7283%2051.8683C24.6462%2051.9654%2025.5686%2052.014%2026.4916%2052.0138C27.2954%2052.0138%2028.0933%2051.9764%2028.8795%2051.9037L27.6629%2037.9855Z'%20/%3e%3cpath%20fill='%23000'%20d='M46.0368%2018.1276L50.1542%2018.4875L48.804%2033.9372L44.6768%2033.5774L46.0368%2018.1276ZM36.6484%2018.279H40.7756V33.7858H36.6484V18.279ZM31.0099%2018.1611L32.3601%2033.6109L29.019%2033.9038L27.6668%2018.454L31.0099%2018.1611ZM13.481%2033.7898L9.4698%2018.8099L11.4666%2018.2751L15.4778%2033.2452L13.481%2033.7898ZM21.3817%2033.892L18.6892%2018.6211L21.2343%2018.1729L23.9248%2033.4418L21.3817%2033.892Z'%20/%3e%3c/g%3e%3c/svg%3e)

