TOTAL VOLUME:
$134b
24H VOL:
$103,397,351
24H TRANSACTIONS:
2,388,728,490
OPEN INTEREST:
$1,410,176,180
399,592
Markets across
30,097
events
MATCHED EVENTS:
2,622
PLATFORM COVERAGE:
5
Polymarket:
39%
VS.
Kalshi:
61%

35°C
- Polymarket
35°C - Polymarket
1W
News
Positive
Negative
Neutral
Hover marker for details
Vol.
·
Resolved Jun 30, 2026
Latest in Climate and Weather


Closed: Jun 30, 8:00 AM EST

Polymarket
Description
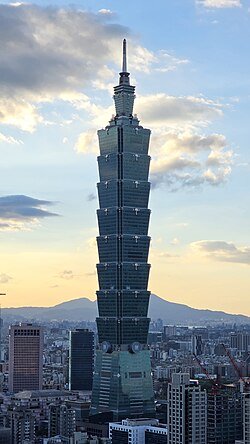
This event group asks about the highest temperature in Taipei on June 30, 2026. However, the source data reveals a critical mismatch: Kalshi's rules reference Minneapolis temperatures on June 28, 2026, while Polymarket references Taipei temperatures on June 30, 2026. These are fundamentally different events with different locations and dates.
PredictionHero - Resolution Divergence Alerts (RDA)
Divergence Detected
Issue: Kalshi's resolution logic references Minneapolis on June 28, 2026, while the event group and Polymarket reference Taipei on June 30, 2026. This is a location and date mismatch that makes Kalshi's market fundamentally unresolvable as stated and creates irreconcilable divergence.Hero tip: Avoid trading Kalshi's market until the platform confirms whether the resolution criteria are a data entry error or if the market intentionally tracks Minneapolis weather. Polymarket's market is resolvable and internally consistent; traders should use Wunderground's historical data for Taipei Songshan Airport as the single source of truth.Critical divergence points:
- Kalshi: All six conditions reference Minneapolis maximum temperature on June 28, 2026, according to National Weather Service Climatological Report (Daily). Conditions cover ranges: <84°F, 84-85°F, 86-87°F, 88-89°F, 90-91°F, and >91°F, with all resolving to Yes. This does not match the event group title asking about Taipei on June 30.
- Polymarket: Thirteen markets collectively cover all possible temperature outcomes for Taipei Songshan Airport on June 30, 2026, measured in whole degrees Celsius (29°C or below, 30°C through 39°C, and 39°C or higher). Resolution source is Wunderground historical data at https://www.wunderground.com/history/daily/tw/taipei/RCSS.
Polymarket
This market will resolve to the temperature range that contains the highest temperature recorded at the Taipei Songshan Airport Station in degrees Celsius on 30 Jun '26. The resolution source for this market will be information from Wunderground, specifically the highest temperature recorded for all times on this day for the Taipei Songshan Airport Station, available here: https://www.wunderground.com/history/daily/tw/taipei/RCSS. To toggle between Fahrenheit and Celsius, click the gear icon next to the search bar and switch the Temperature setting between °F and °C. This market can not resolve until the first data point for the following date has been published on the resolution source. The resolution source for this market measures temperatures to whole degrees Celsius (eg, 9°C). Thus, this is the level of precision that will be used when resolving the market. Revisions to temperatures recorded within this market's timeframe will be considered until the first datapoint for the following date has been published, after which any alterations will not be considered.
Kalshi
Resolution is based on the maximum temperature recorded at Minneapolis/St Paul, MN on June 28, 2026, as reported in the National Weather Service's Climatological Report (Daily). The official data source is accessed through the NWS regional climate portal for the Minneapolis office. Temperature ranges are divided into six bands: 83°F or below, 84-85°F, 86-87°F, 88-89°F, 90-91°F, and 92°F or above. Each temperature band corresponds to a distinct market outcome. Traders should note that preliminary NWS data may be subject to rounding and conversion nuances, and the final official report should be used for resolution. While secondary sources like AccuWeather or Google Weather may provide guidance, only the NWS Climatological Report (Daily) serves as the authoritative source for determining the actual outcome.
Frequently asked questions
Prediction market odds reflect real-money incentives for accuracy, often incorporating meteorological models, historical patterns, and seasonal trends faster than traditional forecasts update. Traders on this market are pricing in current atmospheric conditions, monsoon activity, and climate anomalies specific to late June in Taiwan. Unlike static analyst reports, market odds adjust continuously as new weather data emerges. Comparing this market's odds to official meteorological agency forecasts can reveal whether traders expect conditions to deviate from baseline expectations or align with consensus models.
Polymarket and Kalshi may price this event differently due to variations in user base composition, liquidity depth, and how each platform frames temperature thresholds. Polymarket and Kalshi can show different implied probabilities for the same outcome because of liquidity, fee structure, participant mix, and how each venue defines the contract. Regional trader concentration, dormancy in one venue versus another, and differences in how Celsius and Fahrenheit conversions are interpreted can all widen spreads. Additionally, each platform's fee structure and settlement mechanics may attract different risk appetites, causing one to show higher conviction on cooler outcomes while the other reflects greater uncertainty or bullish heat expectations.
Major weather pattern shifts, tropical cyclone activity, or monsoon intensity changes in Southeast Asia could significantly reprrice this market. Updated seasonal forecasts from meteorological agencies, anomalous atmospheric pressure systems, or sudden warming trends in the Western Pacific may trigger sharp moves. Real-time weather model updates released days before June 30 often catalyze trader repositioning. Additionally, historical temperature records for Taipei in late June and any El Niño or La Niña developments could influence how traders assess the probability of extreme heat on that specific date.
'%3e%3ccircle%20cx='26'%20cy='26'%20r='26'%20fill='%23000'/%3e%3cpath%20fill='%23fff'%20d='M27.6629%2037.9855L31.004%2037.6925L32.1989%2051.3689C33.72%2051.027%2035.2073%2050.5486%2036.6425%2049.9395V37.8085H40.7697V47.7178C42.4942%2046.577%2044.0775%2045.236%2045.4865%2043.7226L46.0172%2037.6591L49.5548%2037.9678C51.5707%2034.0725%2052.5697%2029.7306%2052.4591%2025.3456C52.3484%2020.9605%2051.1317%2016.6746%2048.9219%2012.886L48.7903%2014.392L44.6631%2014.0303L45.1937%207.97067C43.8569%206.58147%2042.3706%205.34447%2040.7619%204.28222V14.2406H36.6347V2.06247C34.8743%201.313%2033.0358%200.762345%2031.1533%200.420753L32.3463%2014.0637L29.0052%2014.3566L27.7513%200.0314647C27.3308%200.0118035%2026.9062%200%2026.4817%200C24.8262%204.44017e-06%2023.1745%200.157349%2021.5487%200.469906L23.9072%2013.8985L21.364%2014.3468L19.0253%201.0853C16.8454%201.73668%2014.7611%202.67345%2012.8266%203.87129L15.4601%2013.7019L13.4634%2014.2387L11.0146%205.09226C9.12509%206.49278%207.43337%208.1422%205.98527%209.99577L7.26077%2013.5014L5.80446%2014.0322L4.88665%2011.5097C3.41845%2013.6953%202.29182%2016.092%201.54558%2018.6172L1.95829%2018.4678L7.2647%2033.0387L5.80839%2033.5696L1.06407%2020.5303C-0.0225105%2025.6016%200.430464%2030.8821%202.36486%2035.6941C4.29926%2040.5061%207.62683%2044.6301%2011.9206%2047.5369L9.45605%2038.3355L11.4528%2037.7987L14.4677%2049.0567C16.5333%2050.1354%2018.7355%2050.9291%2021.0142%2051.4161L18.6892%2038.1605L21.2343%2037.7122L23.7283%2051.8683C24.6462%2051.9654%2025.5686%2052.014%2026.4916%2052.0138C27.2954%2052.0138%2028.0933%2051.9764%2028.8795%2051.9037L27.6629%2037.9855Z'%20/%3e%3cpath%20fill='%23000'%20d='M46.0368%2018.1276L50.1542%2018.4875L48.804%2033.9372L44.6768%2033.5774L46.0368%2018.1276ZM36.6484%2018.279H40.7756V33.7858H36.6484V18.279ZM31.0099%2018.1611L32.3601%2033.6109L29.019%2033.9038L27.6668%2018.454L31.0099%2018.1611ZM13.481%2033.7898L9.4698%2018.8099L11.4666%2018.2751L15.4778%2033.2452L13.481%2033.7898ZM21.3817%2033.892L18.6892%2018.6211L21.2343%2018.1729L23.9248%2033.4418L21.3817%2033.892Z'%20/%3e%3c/g%3e%3c/svg%3e)
