TOTAL VOLUME:
$134.2b
24H VOL:
$126,324,530
24H TRANSACTIONS:
2,388,728,490
OPEN INTEREST:
$1,434,646,834
406,019
Markets across
30,401
events
MATCHED EVENTS:
2,689
PLATFORM COVERAGE:
5
Polymarket:
39%
VS.
Kalshi:
61%
22°C
- Polymarket
22°C - Polymarket
1W
News
Positive
Negative
Neutral
Hover marker for details
Vol.
·
Resolved Jul 9, 2026
Latest in Climate and Weather


Closed: Jul 8, 8:00 AM EST

Polymarket
Description
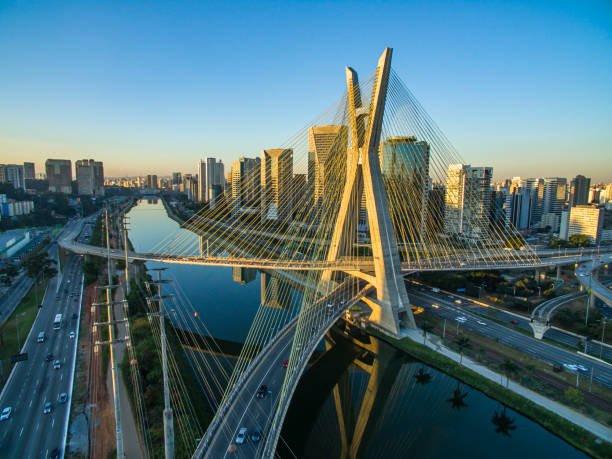
This market will resolve to the temperature range that contains the highest temperature recorded at the Sao Paulo-Guarulhos International Airport Station in degrees Celsius on 8 Jul '26. The resolution source for this market will be information from Wunderground, specifically the highest temperature recorded for all times on this day for the Sao Paulo-Guarulhos International Airport Station, available here: https://www.wunderground.com/history/daily/br/guarulhos/SBGR. To toggle between Fahrenheit and Celsius, click the gear icon next to the search bar and switch the Temperature setting between °F and °C. This market can not resolve until the first data point for the following date has been published on the resolution source. The resolution source for this market measures temperatures to whole degrees Celsius (eg, 9°C). Thus, this is the level of precision that will be used when resolving the market. Revisions to temperatures recorded within this market's timeframe will be considered until the first datapoint for the following date has been published, after which any alterations will not be considered.
Polymarket
This market will resolve to the temperature range that contains the highest temperature recorded at the Sao Paulo-Guarulhos International Airport Station in degrees Celsius on 8 Jul '26. The resolution source for this market will be information from Wunderground, specifically the highest temperature recorded for all times on this day for the Sao Paulo-Guarulhos International Airport Station, available here: https://www.wunderground.com/history/daily/br/guarulhos/SBGR. To toggle between Fahrenheit and Celsius, click the gear icon next to the search bar and switch the Temperature setting between °F and °C. This market can not resolve until the first data point for the following date has been published on the resolution source. The resolution source for this market measures temperatures to whole degrees Celsius (eg, 9°C). Thus, this is the level of precision that will be used when resolving the market. Revisions to temperatures recorded within this market's timeframe will be considered until the first datapoint for the following date has been published, after which any alterations will not be considered.
Frequently asked questions
Prediction market odds reflect real-money trader conviction and often incorporate the latest meteorological data faster than traditional analyst consensus. While weather forecasters publish point estimates and confidence intervals based on numerical models, this market aggregates dispersed trader knowledge into a probability distribution. Comparing the two reveals whether the crowd is pricing in more or less uncertainty than official forecasts suggest, and whether traders expect conditions warmer or cooler than the consensus. Over time, markets tend to converge toward verifiable outcomes, making them a useful benchmark against published forecasts.
On Polymarket, traders set prices by buying and selling outcome shares in an automated market maker. On Polymarket, prices reflect that venue's order book, liquidity, and how traders price the outcome right now. Each temperature range has its own contract, and the cost of a share reflects the crowd's estimated probability of that outcome occurring. As new information arrives—updated weather models, seasonal patterns, or real-time atmospheric data—traders adjust their positions, moving prices up or down. The market price at any moment represents the marginal trader's belief about the likelihood of that temperature band being the highest on July 8.
This market resolves around Jul 8, 2026, once July 8 has passed and the highest temperature in São Paulo for that day is verifiable from credible public sources. The outcome is determined by comparing reported temperature readings against the predefined ranges offered in the market. Whichever outcome bracket contains the actual peak temperature is declared correct, and traders holding shares in that outcome receive their payout. Resolution typically occurs within hours or a day after the event, once official meteorological data is published and confirmed.
Major weather pattern shifts—such as unexpected cold fronts, heat waves, or changes to seasonal atmospheric circulation—can significantly move odds. Updated long-range forecasts from meteorological agencies often trigger repricing, especially as July 8 draws closer and model confidence increases. Real-time atmospheric conditions, including humidity, pressure systems, and solar activity, feed into trader expectations. Additionally, historical temperature records for that date and time of year serve as anchors; traders may adjust if climatological baselines shift or if unusual weather systems develop in the weeks leading up to the event.
'%3e%3ccircle%20cx='26'%20cy='26'%20r='26'%20fill='%23000'/%3e%3cpath%20fill='%23fff'%20d='M27.6629%2037.9855L31.004%2037.6925L32.1989%2051.3689C33.72%2051.027%2035.2073%2050.5486%2036.6425%2049.9395V37.8085H40.7697V47.7178C42.4942%2046.577%2044.0775%2045.236%2045.4865%2043.7226L46.0172%2037.6591L49.5548%2037.9678C51.5707%2034.0725%2052.5697%2029.7306%2052.4591%2025.3456C52.3484%2020.9605%2051.1317%2016.6746%2048.9219%2012.886L48.7903%2014.392L44.6631%2014.0303L45.1937%207.97067C43.8569%206.58147%2042.3706%205.34447%2040.7619%204.28222V14.2406H36.6347V2.06247C34.8743%201.313%2033.0358%200.762345%2031.1533%200.420753L32.3463%2014.0637L29.0052%2014.3566L27.7513%200.0314647C27.3308%200.0118035%2026.9062%200%2026.4817%200C24.8262%204.44017e-06%2023.1745%200.157349%2021.5487%200.469906L23.9072%2013.8985L21.364%2014.3468L19.0253%201.0853C16.8454%201.73668%2014.7611%202.67345%2012.8266%203.87129L15.4601%2013.7019L13.4634%2014.2387L11.0146%205.09226C9.12509%206.49278%207.43337%208.1422%205.98527%209.99577L7.26077%2013.5014L5.80446%2014.0322L4.88665%2011.5097C3.41845%2013.6953%202.29182%2016.092%201.54558%2018.6172L1.95829%2018.4678L7.2647%2033.0387L5.80839%2033.5696L1.06407%2020.5303C-0.0225105%2025.6016%200.430464%2030.8821%202.36486%2035.6941C4.29926%2040.5061%207.62683%2044.6301%2011.9206%2047.5369L9.45605%2038.3355L11.4528%2037.7987L14.4677%2049.0567C16.5333%2050.1354%2018.7355%2050.9291%2021.0142%2051.4161L18.6892%2038.1605L21.2343%2037.7122L23.7283%2051.8683C24.6462%2051.9654%2025.5686%2052.014%2026.4916%2052.0138C27.2954%2052.0138%2028.0933%2051.9764%2028.8795%2051.9037L27.6629%2037.9855Z'%20/%3e%3cpath%20fill='%23000'%20d='M46.0368%2018.1276L50.1542%2018.4875L48.804%2033.9372L44.6768%2033.5774L46.0368%2018.1276ZM36.6484%2018.279H40.7756V33.7858H36.6484V18.279ZM31.0099%2018.1611L32.3601%2033.6109L29.019%2033.9038L27.6668%2018.454L31.0099%2018.1611ZM13.481%2033.7898L9.4698%2018.8099L11.4666%2018.2751L15.4778%2033.2452L13.481%2033.7898ZM21.3817%2033.892L18.6892%2018.6211L21.2343%2018.1729L23.9248%2033.4418L21.3817%2033.892Z'%20/%3e%3c/g%3e%3c/svg%3e)

