TOTAL VOLUME:
$134.3b
24H VOL:
$121,875,814
24H TRANSACTIONS:
2,403,290,006
OPEN INTEREST:
$1,437,844,306
405,535
Markets across
30,523
events
MATCHED EVENTS:
2,681
PLATFORM COVERAGE:
5
Polymarket:
39%
VS.
Kalshi:
61%
34°C
- Polymarket
34°C - Polymarket
1W
News
Positive
Negative
Neutral
Hover marker for details
Vol.
·
Resolved Jul 13, 2026


Closed: Jul 12, 8:00 AM EST

Polymarket
Description
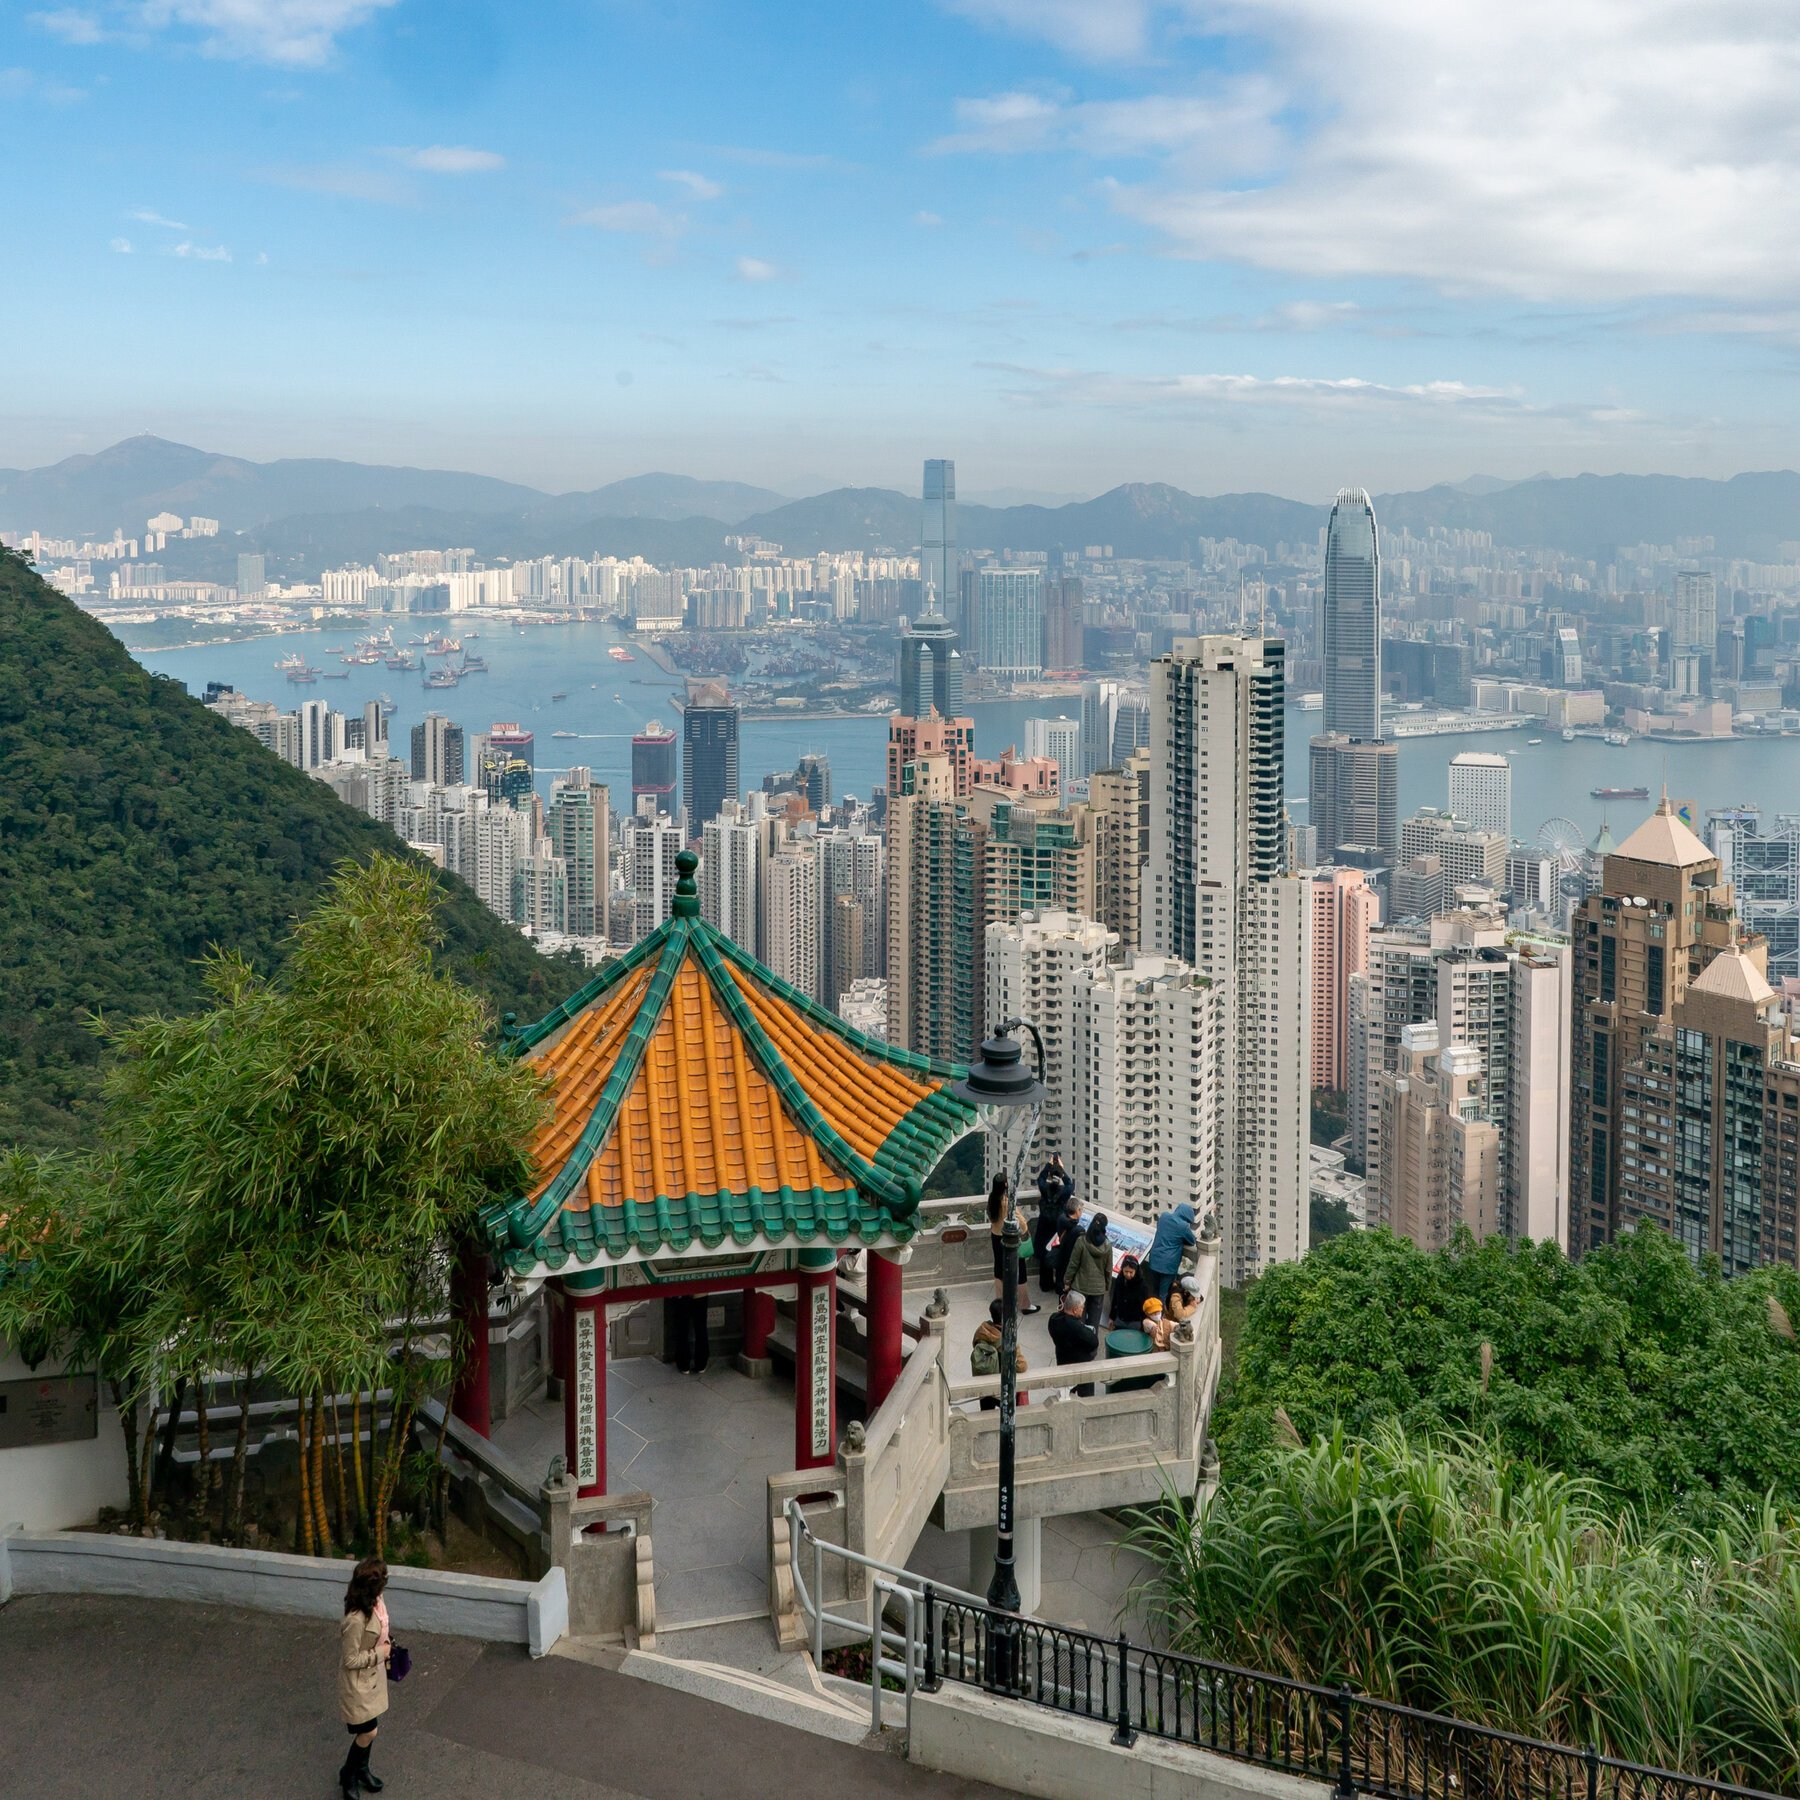
This market will resolve to the temperature range that contains the highest temperature recorded by the Hong Kong Observatory in degrees Celsius on 12 Jul '26. The resolution source for this market will be information from the Hong Kong Observatory, specifically the "Absolute Daily Max (deg. C)" the specified date once information is finalized in the relevant "Daily Extract", available here: https://www.weather.gov.hk/en/cis/climat.htm This market can not resolve until data for this date has been published. The resolution source for this market measures temperatures in Celsius to one decimal place (eg, 9.1°C). Thus, this is the level of precision that will be used when resolving the market. Any revisions to temperatures recorded after data is initially published for this market's timeframe will not be considered for this market's resolution.
Polymarket
This market will resolve to the temperature range that contains the highest temperature recorded by the Hong Kong Observatory in degrees Celsius on 12 Jul '26. The resolution source for this market will be information from the Hong Kong Observatory, specifically the "Absolute Daily Max (deg. C)" the specified date once information is finalized in the relevant "Daily Extract", available here: https://www.weather.gov.hk/en/cis/climat.htm This market can not resolve until data for this date has been published. The resolution source for this market measures temperatures in Celsius to one decimal place (eg, 9.1°C). Thus, this is the level of precision that will be used when resolving the market. Any revisions to temperatures recorded after data is initially published for this market's timeframe will not be considered for this market's resolution.
Frequently asked questions
Prediction market odds often diverge from traditional meteorological forecasts because they incorporate real-time trader sentiment and uncertainty pricing. While weather analysts publish point estimates and confidence intervals based on atmospheric models, this market reflects what thousands of traders collectively believe will occur, including their assessment of model error and edge cases. The market's odds can run ahead of or lag behind official forecasts depending on new data releases, model updates, or shifts in trader conviction. Comparing the current odds to recent analyst statements can reveal whether the market is pricing in more or less risk than the consensus view, making it a useful cross-check for understanding forecast confidence.
On Polymarket, this market is priced through an automated market maker that converts trader bets into real-time odds. On Polymarket, prices reflect that venue's order book, liquidity, and how traders price the outcome right now. Each outcome has a price between 0 and 1, where higher prices reflect greater trader confidence. When you buy a share, you're wagering that the outcome will occur; if it does, your share settles at 1. The spread between bid and ask prices tightens as volume increases, so deeper liquidity typically means more efficient pricing. Traders can enter or exit positions at any time before Jul 12, 2026, allowing continuous price discovery as new information arrives.
This market resolves around Jul 12, 2026, once the highest temperature recorded in Hong Kong on July 12 is verified and finalized. The outcome is determined by comparing the actual recorded high temperature against the market's predefined outcome thresholds. Once the event occurs and credible public reporting confirms the final temperature, the market settles automatically and winning positions are paid out. Traders should monitor official weather station data and announcements as the date approaches to understand how the outcome will be measured and confirmed.
Several factors can shift odds in this market before Jul 12, 2026. Updated seasonal weather forecasts, tropical storm warnings, or shifts in atmospheric pressure patterns can trigger significant repricing. Major model runs from meteorological agencies often move the market when they show materially different temperature outlooks. Real-time weather data, such as sea-surface temperature anomalies or monsoon intensity reports, can also influence trader positioning. As July 12 approaches, intraday forecasts and actual observed temperatures in the days leading up to the event will likely drive increased trading activity and volatility. Traders should stay alert to weather alerts and official forecasts to time their positions effectively.
'%3e%3ccircle%20cx='26'%20cy='26'%20r='26'%20fill='%23000'/%3e%3cpath%20fill='%23fff'%20d='M27.6629%2037.9855L31.004%2037.6925L32.1989%2051.3689C33.72%2051.027%2035.2073%2050.5486%2036.6425%2049.9395V37.8085H40.7697V47.7178C42.4942%2046.577%2044.0775%2045.236%2045.4865%2043.7226L46.0172%2037.6591L49.5548%2037.9678C51.5707%2034.0725%2052.5697%2029.7306%2052.4591%2025.3456C52.3484%2020.9605%2051.1317%2016.6746%2048.9219%2012.886L48.7903%2014.392L44.6631%2014.0303L45.1937%207.97067C43.8569%206.58147%2042.3706%205.34447%2040.7619%204.28222V14.2406H36.6347V2.06247C34.8743%201.313%2033.0358%200.762345%2031.1533%200.420753L32.3463%2014.0637L29.0052%2014.3566L27.7513%200.0314647C27.3308%200.0118035%2026.9062%200%2026.4817%200C24.8262%204.44017e-06%2023.1745%200.157349%2021.5487%200.469906L23.9072%2013.8985L21.364%2014.3468L19.0253%201.0853C16.8454%201.73668%2014.7611%202.67345%2012.8266%203.87129L15.4601%2013.7019L13.4634%2014.2387L11.0146%205.09226C9.12509%206.49278%207.43337%208.1422%205.98527%209.99577L7.26077%2013.5014L5.80446%2014.0322L4.88665%2011.5097C3.41845%2013.6953%202.29182%2016.092%201.54558%2018.6172L1.95829%2018.4678L7.2647%2033.0387L5.80839%2033.5696L1.06407%2020.5303C-0.0225105%2025.6016%200.430464%2030.8821%202.36486%2035.6941C4.29926%2040.5061%207.62683%2044.6301%2011.9206%2047.5369L9.45605%2038.3355L11.4528%2037.7987L14.4677%2049.0567C16.5333%2050.1354%2018.7355%2050.9291%2021.0142%2051.4161L18.6892%2038.1605L21.2343%2037.7122L23.7283%2051.8683C24.6462%2051.9654%2025.5686%2052.014%2026.4916%2052.0138C27.2954%2052.0138%2028.0933%2051.9764%2028.8795%2051.9037L27.6629%2037.9855Z'%20/%3e%3cpath%20fill='%23000'%20d='M46.0368%2018.1276L50.1542%2018.4875L48.804%2033.9372L44.6768%2033.5774L46.0368%2018.1276ZM36.6484%2018.279H40.7756V33.7858H36.6484V18.279ZM31.0099%2018.1611L32.3601%2033.6109L29.019%2033.9038L27.6668%2018.454L31.0099%2018.1611ZM13.481%2033.7898L9.4698%2018.8099L11.4666%2018.2751L15.4778%2033.2452L13.481%2033.7898ZM21.3817%2033.892L18.6892%2018.6211L21.2343%2018.1729L23.9248%2033.4418L21.3817%2033.892Z'%20/%3e%3c/g%3e%3c/svg%3e)

