TOTAL VOLUME:
$154.4b
24H VOL:
$290,393,159
24H TRANSACTIONS:
2,984,640,614
OPEN INTEREST:
$1,944,100,805
420,493
Markets across
40,511
events
MATCHED EVENTS:
4,612
PLATFORM COVERAGE:
5
Polymarket:
37%
VS.
Kalshi:
63%
Closed: Nov 1, 10:39 AM EST

Kalshi
Description
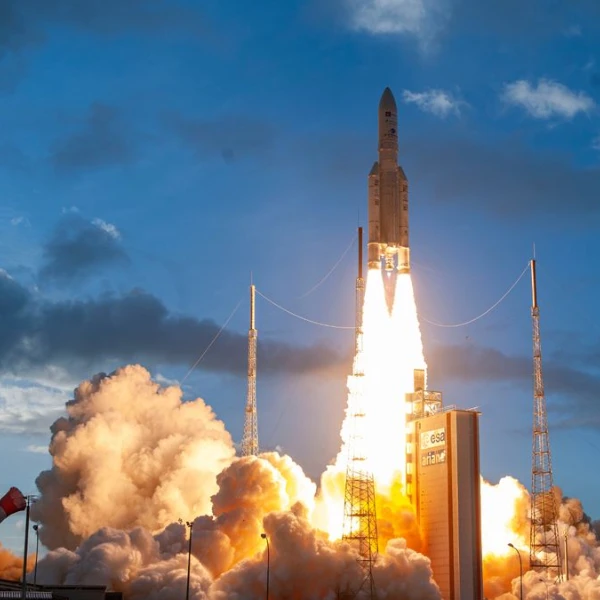
This event tracks the number of space launches conducted by U.S.-licensed commercial operators during October 2026. It provides multiple thresholds for different launch counts, allowing participants to speculate on whether activity will exceed various levels. The outcome depends entirely on actual launch data from that specific month and year.
Kalshi
All markets resolve based on the total number of space launches conducted by U.S.-licensed commercial operators in October 2026. Each market corresponds to a specific numerical threshold (ranging from Above 9 to Above 20 launches). If the actual number of launches exceeds the threshold specified in a given market, that market resolves to Yes; otherwise, it resolves to No. All launch dates are converted to Eastern Time to ensure consistent allocation within the October time period, regardless of where the launch is physically recorded. This unified approach ensures clarity and fairness across all threshold-based markets by applying the same temporal conversion rule to every launch event.
Frequently asked questions
Comparing prediction market odds to analyst forecasts reveals how collective intelligence stacks up against expert opinion. Often, this market demonstrates a different perspective than traditional polls or expert predictions, potentially incorporating a wider range of information and anticipating events more accurately. While analysts may offer specific launch predictions based on schedules and technical assessments, the market reflects the aggregated beliefs of many participants, factoring in unforeseen delays or unexpected successes. This dynamic interplay between expert analysis and crowd wisdom can provide a more nuanced understanding of the likely outcome.
On Kalshi, this market is priced through a continuous order book where traders buy and sell contracts representing different launch totals. The price of each contract reflects the probability of that outcome occurring, as determined by supply and demand. On Kalshi, prices reflect that venue's order book, liquidity, and how traders price the outcome right now. As more traders believe a particular number of launches is likely, the price of contracts for that outcome will increase, and vice versa. This creates a dynamic pricing mechanism that constantly adjusts to new information and changing perceptions about the event. The current market reflects the collective assessment of all participants.
This market resolves around Nov 8, 2026, with the outcome confirmed once the total number of space launches in October is verifiable from credible public reporting. The resolution will be based on publicly available data from reputable space agencies and launch providers. This includes all orbital launch attempts, regardless of success or failure, that occur during the calendar month of October. The final outcome will be a whole number representing the total number of launches completed during that period, establishing the winning contracts in this market.
Several signals and events could significantly move this market before it resolves. Any announcements regarding launch delays, successful launches, or launch failures will directly impact the odds. Unexpected technical issues with rockets or payloads, changes in weather conditions at launch sites, or geopolitical events affecting space programs could also cause shifts in market prices. Furthermore, major announcements from space agencies like SpaceX, NASA, or others regarding their launch schedules will be closely watched by traders, potentially leading to increased volume and price fluctuations in this market.


