TOTAL VOLUME:
$134.2b
24H VOL:
$126,324,530
24H TRANSACTIONS:
2,388,728,490
OPEN INTEREST:
$1,434,646,834
406,019
Markets across
30,401
events
MATCHED EVENTS:
2,689
PLATFORM COVERAGE:
5
Polymarket:
39%
VS.
Kalshi:
61%
Above 0
- Kalshi
Above 0 - Kalshi
1W
News
Positive
Negative
Neutral
Hover marker for details
Vol.
·
Resolved Jul 23, 2026
Latest in Politics


Closed: Jul 23, 10:59 AM EST

Kalshi
Description
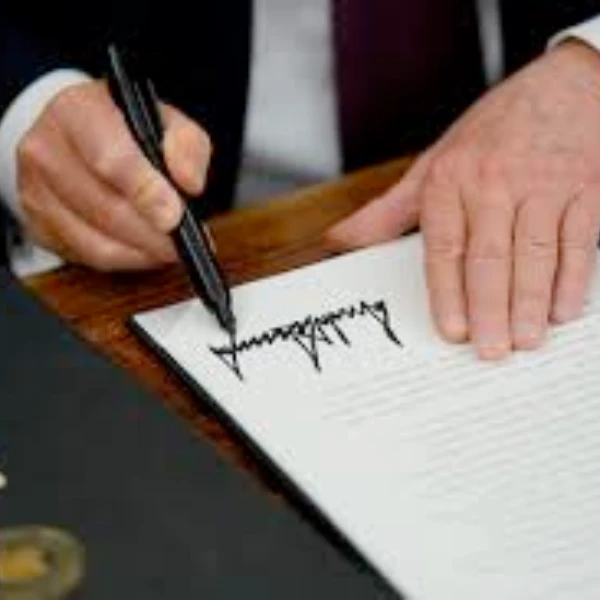
This event tracks the number of Executive Orders signed by the President during the week of July 12–18, 2026. Executive Orders are formal presidential directives that carry the force of law and must be published in the Federal Register to count.
Kalshi
An Executive Order is defined as a numbered presidential directive that is formally titled "Executive Order" followed by a number, is signed by the President, is published in the Federal Register, and has the force of law. All documents officially designated as Executive Orders with sequential numbering count toward this event, including those that are later revoked or amended. The signing date as recorded in the Federal Register determines which period an Executive Order belongs to; for example, an order signed on July 18 but published in the Federal Register after the period ends would still count if the Federal Register shows the July 18 signing date. The market resolves based on whether the President signs above specified thresholds during July 12–18, 2026. Resolution is determined by the signing date recorded in the Federal Register, not the publication date. The contract expires two weeks after the end of the period, though expiration may be moved earlier if an Executive Order dated after July 18, 2026 is posted to the Federal Register.
Frequently asked questions
Prediction markets and traditional polls measure different things: polls capture stated public opinion at a snapshot in time, while prediction markets aggregate real-money bets on actual outcomes. Traders in this market are financially incentivized to forecast accurately, which often leads market odds to diverge from polling sentiment. For executive order predictions, market prices typically reflect informed expectations about administrative capacity and political priorities rather than general public sentiment. Comparing this market's odds to analyst commentary or historical precedent can reveal whether traders expect higher or lower activity than typical baselines.
On Kalshi, this market is priced through a continuous order-book mechanism where traders submit bids and asks for each outcome. On Kalshi, prices reflect that venue's order book, liquidity, and how traders price the outcome right now. The price of any outcome reflects the last matched trade and represents the implied probability that traders assign to it. As new information emerges or sentiment shifts, buyers and sellers adjust their orders, causing prices to move in real time. Higher prices indicate stronger market confidence in that outcome, while lower prices suggest traders view it as less likely. This mechanism ensures prices stay responsive to breaking news and changing expectations throughout the trading period.
This market resolves around Aug 1, 2026, once the trading window closes and the week in question has concluded. The outcome is determined by counting the total number of executive orders signed during that specific period and verified against credible public sources. Traders who correctly predicted the final count receive payouts proportional to their position size, while incorrect predictions result in losses. Resolution is final once the count is confirmed and published through official channels.
Several catalysts could shift odds in this market significantly. Major policy announcements or legislative developments may signal the administration's priorities and expected executive activity. Breaking news about political crises, court rulings, or international events could accelerate or delay executive action. Public statements from the President or senior advisors about planned orders often move prices sharply. Historical patterns—such as typical executive order volume during specific weeks or policy cycles—provide baseline expectations that traders adjust when new information arrives. Unexpected departures or staffing changes can also influence market sentiment about administrative capacity and focus.


'%3e%3ccircle%20cx='26'%20cy='26'%20r='26'%20fill='%23000'/%3e%3cpath%20fill='%23fff'%20d='M27.6629%2037.9855L31.004%2037.6925L32.1989%2051.3689C33.72%2051.027%2035.2073%2050.5486%2036.6425%2049.9395V37.8085H40.7697V47.7178C42.4942%2046.577%2044.0775%2045.236%2045.4865%2043.7226L46.0172%2037.6591L49.5548%2037.9678C51.5707%2034.0725%2052.5697%2029.7306%2052.4591%2025.3456C52.3484%2020.9605%2051.1317%2016.6746%2048.9219%2012.886L48.7903%2014.392L44.6631%2014.0303L45.1937%207.97067C43.8569%206.58147%2042.3706%205.34447%2040.7619%204.28222V14.2406H36.6347V2.06247C34.8743%201.313%2033.0358%200.762345%2031.1533%200.420753L32.3463%2014.0637L29.0052%2014.3566L27.7513%200.0314647C27.3308%200.0118035%2026.9062%200%2026.4817%200C24.8262%204.44017e-06%2023.1745%200.157349%2021.5487%200.469906L23.9072%2013.8985L21.364%2014.3468L19.0253%201.0853C16.8454%201.73668%2014.7611%202.67345%2012.8266%203.87129L15.4601%2013.7019L13.4634%2014.2387L11.0146%205.09226C9.12509%206.49278%207.43337%208.1422%205.98527%209.99577L7.26077%2013.5014L5.80446%2014.0322L4.88665%2011.5097C3.41845%2013.6953%202.29182%2016.092%201.54558%2018.6172L1.95829%2018.4678L7.2647%2033.0387L5.80839%2033.5696L1.06407%2020.5303C-0.0225105%2025.6016%200.430464%2030.8821%202.36486%2035.6941C4.29926%2040.5061%207.62683%2044.6301%2011.9206%2047.5369L9.45605%2038.3355L11.4528%2037.7987L14.4677%2049.0567C16.5333%2050.1354%2018.7355%2050.9291%2021.0142%2051.4161L18.6892%2038.1605L21.2343%2037.7122L23.7283%2051.8683C24.6462%2051.9654%2025.5686%2052.014%2026.4916%2052.0138C27.2954%2052.0138%2028.0933%2051.9764%2028.8795%2051.9037L27.6629%2037.9855Z'%20/%3e%3cpath%20fill='%23000'%20d='M46.0368%2018.1276L50.1542%2018.4875L48.804%2033.9372L44.6768%2033.5774L46.0368%2018.1276ZM36.6484%2018.279H40.7756V33.7858H36.6484V18.279ZM31.0099%2018.1611L32.3601%2033.6109L29.019%2033.9038L27.6668%2018.454L31.0099%2018.1611ZM13.481%2033.7898L9.4698%2018.8099L11.4666%2018.2751L15.4778%2033.2452L13.481%2033.7898ZM21.3817%2033.892L18.6892%2018.6211L21.2343%2018.1729L23.9248%2033.4418L21.3817%2033.892Z'%20/%3e%3c/g%3e%3c/svg%3e)
%20scale(0.82)%20translate(-12.5%20-12.5)'%3e%3cpath%20fill='%23000'%20fill-rule='evenodd'%20d='M9.619%2012.69h12.995a1.382%201.382%200%200%200%200-2.76h-3.932l5.298-5.405.032-.032L22.08%202.56h-5.255V1.38c0-.76-.619-1.38-1.38-1.38H9.81c-.76%200-1.38.62-1.38%201.38V11.5c0%20.657.534%201.19%201.19%201.19m12.995-2.186h-5.3l5.89-6.01-1.139-1.139-5.813%205.933V1.38a.806.806%200%200%200-.805-.806.806.806%200%200%200-.805.806v9.545c0%20.656.533%201.19%201.189%201.19h6.783a.806.806%200%200%200%200-1.612'%20clip-rule='evenodd'/%3e%3cpath%20fill='%23000'%20fill-rule='evenodd'%20d='M14.393%2011.31H1.398a1.382%201.382%200%200%200%200%202.76H5.33L.032%2019.476%200%2019.507l1.931%201.933h5.255v1.18c0%20.76.619%201.38%201.379%201.38h5.638c.76%200%201.38-.62%201.38-1.38V12.5c0-.657-.534-1.19-1.19-1.19m.293%2011.31a.8.8%200%200%201-.788.805.797.797%200%200%201-.787-.805v-7.904l-5.69%205.928-1.113-1.139%205.764-6.005H6.884a.797.797%200%200%201-.787-.806c0-.444.353-.806.787-.806h6.638c.642%200%201.164.534%201.164%201.19z'%20clip-rule='evenodd'/%3e%3c/g%3e%3c/svg%3e)