TOTAL VOLUME:
$134.1b
24H VOL:
$141,541,542
24H TRANSACTIONS:
2,388,728,490
OPEN INTEREST:
$1,440,096,988
406,065
Markets across
30,522
events
MATCHED EVENTS:
2,692
PLATFORM COVERAGE:
5
Polymarket:
39%
VS.
Kalshi:
61%
Above 6.8%
- Kalshi
Above 6.8% - Kalshi
1W
News
Positive
Negative
Neutral
Hover marker for details
Vol.
·
Resolved Aug 21, 2026
Latest in Elections


Closed: Aug 21, 9:59 AM EST

Kalshi
Description
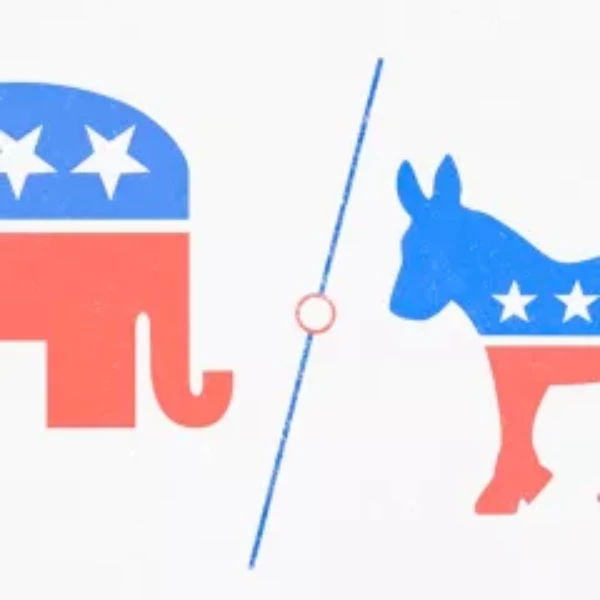
This event gauges the relative strength of the two major U.S. political parties over a defined period. It uses a time-weighted difference in voter preferences to determine which party is favored. The result hinges on whether the Democratic advantage exceeds a specified percentage by the deadline.
Kalshi
If the VoteHub 2026 generic ballot margin (D − R, time-weighted) is above 6.8% at 10:00 AM ET on Aug 21, 2026, then the market resolves to Yes.
Frequently asked questions
This market often moves in tandem with public polling trends, but it can diverge due to trader positioning on economic factors or campaign dynamics. When polls show a tight race, this market may reflect higher uncertainty through wider spreads. Over time, traders may price in expectations beyond raw poll numbers, such as fundraising strength or candidate viability.
This market resolves around Aug 21, 2026, with the outcome confirmed once the event is verifiable from credible public reporting. The result hinges on aggregated polling data over the specified window, interpreted according to the market’s defined rules, and will be finalized once official sources confirm the trend.
Several factors could shift this market before Aug 21, 2026. Key drivers include major poll releases tracking voter preferences, significant economic or geopolitical developments affecting party support, and high-profile campaign events such as debates or party conventions. Media coverage framing these events may also influence trader sentiment. As the election cycle progresses, realignment in voter intentions or shifting public policy priorities could further impact pricing dynamics.
