TOTAL VOLUME:
$154.7b
24H VOL:
$279,496,801
24H TRANSACTIONS:
2,984,640,614
OPEN INTEREST:
$1,923,931,766
416,910
Markets across
40,107
events
MATCHED EVENTS:
4,571
PLATFORM COVERAGE:
5
Polymarket:
37%
VS.
Kalshi:
63%

Time left: 03d:11h:30m
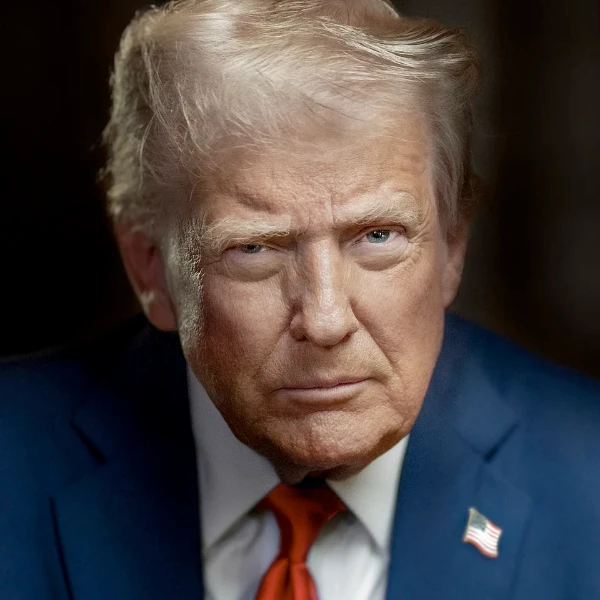
Will the President's approval rating be above 39.0 according to RealClearPolitics?
$
Description
This event tracks the public's perception of the President's job performance at a specific future date, reflecting how citizen satisfaction or dissatisfaction is measured through polling data. The outcome depends entirely on where the measured approval percentage falls within defined ranges at the exact evaluation time.
Kalshi
All markets resolve based solely on the President's approval rating as reported by RealClearPolitics at exactly 11:00 AM ET on November 06, 2026. Each market corresponds to a distinct numerical range of approval percentages: below 37.3%, between 37.3%–37.5%, 37.6%–37.8%, 37.9%–38.1%, 38.2%–38.4%, 38.5%–38.7%, 38.8%–39.0%, or above 39.0%. The market associated with the range that contains the actual reported rating resolves to 'Yes,' while all others resolve to 'No.' All markets share the same determination time and data source.
Frequently asked questions
On Kalshi, this market is priced through a continuous double auction, where traders buy and sell contracts representing different potential approval rating ranges. The price of a contract reflects the probability of that outcome occurring, as perceived by the market participants. On Kalshi, prices reflect that venue's order book, liquidity, and how traders price the outcome right now. As more traders participate and new information becomes available, the prices will adjust accordingly, providing a dynamic assessment of the likelihood of various scenarios. The market’s price movements are driven by supply and demand, with higher demand pushing prices up and lower demand pushing them down. This creates a constantly updating forecast.
This market resolves around Nov 6, 2026, with the outcome confirmed once the event is verifiable from credible public reporting. Specifically, the RealClearPolitics average of President Trump’s approval rating will be used to determine the result. Traders will be able to see the final outcome and whether their predictions were accurate following the resolution date. The market’s resolution will be based on a widely recognized and publicly available source of data, ensuring transparency and objectivity in the process. This provides a clear and defined endpoint for this market.
Several factors could significantly influence this market between now and Nov 6, 2026. Major economic shifts, significant political events like legislative victories or scandals, and unexpected foreign policy developments could all impact President Trump’s approval ratings. Changes in key political demographics or shifts in public opinion on important issues could also drive movement. Additionally, any major news coverage or statements made by President Trump or prominent political figures could cause traders to reassess their positions, leading to fluctuations in the market prices. Unexpected events are always a possibility and could quickly alter the outlook.
