TOTAL VOLUME:
$154.4b
24H VOL:
$230,589,906
24H TRANSACTIONS:
2,984,028,936
OPEN INTEREST:
$1,885,293,300
410,482
Markets across
40,213
events
MATCHED EVENTS:
4,340
PLATFORM COVERAGE:
5
Polymarket:
37%
VS.
Kalshi:
63%
Closed: Oct 30, 4:06 PM EST

Kalshi
Description
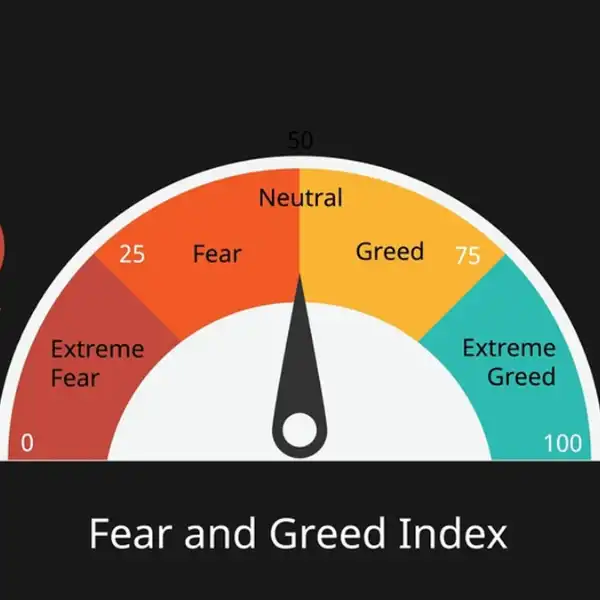
The Fear & Greed Index measures market sentiment by aggregating data points like volatility, momentum, put-to-call ratios, and market breadth into a single numerical value that is then categorized. On any given day, this index classification reflects whether investors are predominantly driven by fear or greed. Observing this classification on a specific future date allows analysts to gauge anticipated market psychology at that moment.
Kalshi
If the value at 4:00 PM ET on Oct 30, 2026 is Extreme Fear, then the market resolves to Yes. If the value at 4:00 PM ET on Oct 30, 2026 is Fear, then the market resolves to Yes. If the value at 4:00 PM ET on Oct 30, 2026 is Neutral, then the market resolves to Yes. If the value at 4:00 PM ET on Oct 30, 2026 is Greed, then the market resolves to Yes. If the value at 4:00 PM ET on Oct 30, 2026 is Extreme Greed, then the market resolves to Yes.
Frequently asked questions
Currently, it's difficult to directly compare prediction market odds to specific analyst forecasts for the Fear & Greed Index. However, this market represents a collective forecast from a diverse group of traders, potentially incorporating a wider range of information and perspectives than a single analyst’s prediction. If analysts generally anticipate a high level of fear or greed, we might see corresponding price movements in this market. Discrepancies could arise if traders believe analysts are overlooking key factors influencing the index.
On Kalshi, this market is priced through a continuous double auction, meaning buyers and sellers submit bids and offers, and the price fluctuates based on supply and demand. Traders are essentially betting on the probability of the Fear & Greed Index falling within a certain range on October 30, 2026. On Kalshi, prices reflect that venue's order book, liquidity, and how traders price the outcome right now. The price reflects the collective assessment of all participants, and changes as new information becomes available or sentiment shifts. Higher prices indicate greater confidence in a particular outcome.
This market resolves around Nov 6, 2026, with the outcome confirmed once the event is verifiable from credible public reporting. The final price will reflect the actual Fear & Greed Index value as reported on that date. Traders who correctly predicted the outcome will receive a payout based on the market price at resolution. It’s important to monitor news and data releases related to economic indicators and market sentiment leading up to the resolution date, as these factors can significantly influence the index.
Several signals or events could significantly move this market. Major economic data releases, such as inflation reports, employment figures, and GDP growth, are likely to have an impact. Unexpected geopolitical events or shifts in investor sentiment could also cause volatility. Changes in monetary policy by central banks, like interest rate adjustments, are another key factor. Any news that affects overall market risk appetite or investor confidence will likely be reflected in the price of this market.


