TOTAL VOLUME:
$134.1b
24H VOL:
$141,541,542
24H TRANSACTIONS:
2,388,728,490
OPEN INTEREST:
$1,440,096,988
406,065
Markets across
30,522
events
MATCHED EVENTS:
2,692
PLATFORM COVERAGE:
5
Polymarket:
39%
VS.
Kalshi:
61%
Drake
- Kalshi
Drake - Kalshi
1W
News
Positive
Negative
Neutral
Hover marker for details
Vol.
·
Resolved Jun 28, 2026


Closed: Jun 25, 11:59 PM EST

Kalshi
Description
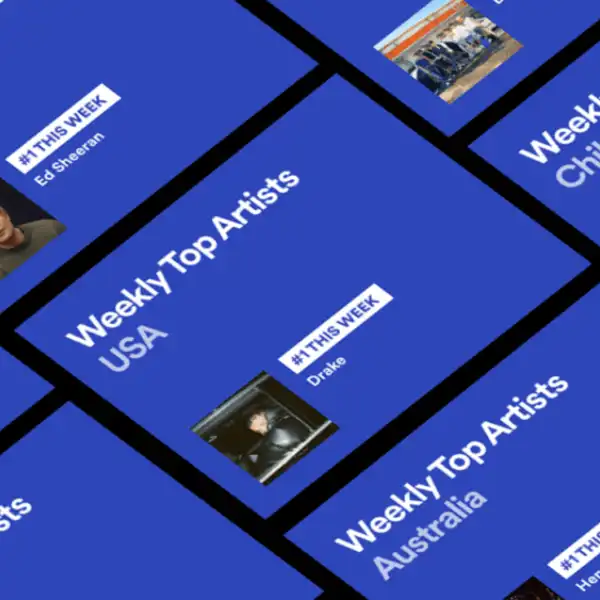
Spotify's Weekly Top Artists USA chart ranks the most-streamed artists in the United States based on listening activity during a specific week. This market determines which artist will hold the #1 position on the chart dated June 25, 2026.
Kalshi
The market resolves to Yes if any of the specified artists—Olivia Rodrigo, Drake, Morgan Wallen, Taylor Swift, Michael Jackson, Noah Kahan, Bad Bunny, Ariana Grande, Ella Langley, Kanye West, The Weeknd, Justin Bieber, Malcolm Todd, YoungBoy Never Broke Again, or Bruno Mars—achieves the #1 ranking on Spotify's Weekly Top Artists USA chart for the chart dated June 25, 2026. Resolution is based on the official Spotify chart data published for that specific date. The market is descriptive in nature and does not imply any endorsement by Spotify or affiliation between Spotify and Kalshi.
Frequently asked questions
Prediction market odds reflect real-money trader conviction and aggregate dispersed information across thousands of participants, often diverging from traditional analyst rankings or music industry forecasts. While music critics and chart analysts may rely on historical trends and insider knowledge, this market prices in live betting activity and evolving public sentiment. The two approaches complement each other: markets excel at capturing unexpected momentum shifts, while expert analysis provides context on artist trajectory and competitive dynamics that shape chart outcomes.
On Kalshi, this market is priced through continuous order-book matching, where traders buy and sell shares representing each artist's probability of topping the chart. On Kalshi, prices reflect that venue's order book, liquidity, and how traders price the outcome right now. Prices move in real time as new information arrives—streaming milestones, radio play, or surprise releases—and traders adjust their positions accordingly. The spread between bid and ask reflects market liquidity and uncertainty; tighter spreads indicate high confidence and trading volume, while wider spreads suggest lower conviction or fewer active participants.
This market resolves around Jul 9, 2026, with the outcome confirmed once the official weekly chart data for June 25, 2026 is verified against credible public sources. The winning artist is determined by the artist holding the number-one position on the designated chart at that time. Traders holding shares in the correct outcome receive their payout, while incorrect positions expire worthless.
Major catalysts include surprise album or single releases, viral social media moments, award show performances, and streaming platform playlist placements that boost visibility. Chart-eligible artists gaining radio rotation or securing high-profile collaborations can shift odds significantly. Additionally, unexpected chart debuts or comebacks by established artists may reshape trader expectations. Real-time streaming data, fan engagement metrics, and industry news all influence market prices as traders reassess each contender's likelihood of claiming the top spot by late June 2026.
