TOTAL VOLUME:
$134.2b
24H VOL:
$126,590,312
24H TRANSACTIONS:
2,388,728,490
OPEN INTEREST:
$1,439,516,703
404,175
Markets across
30,277
events
MATCHED EVENTS:
2,685
PLATFORM COVERAGE:
5
Polymarket:
39%
VS.
Kalshi:
61%
Drake
- Kalshi
Drake - Kalshi
1W
News
Positive
Negative
Neutral
Hover marker for details
Vol.
·
Resolved Jun 12, 2026
Latest in Entertainment


Closed: Jun 11, 11:59 PM EST

Kalshi
Description
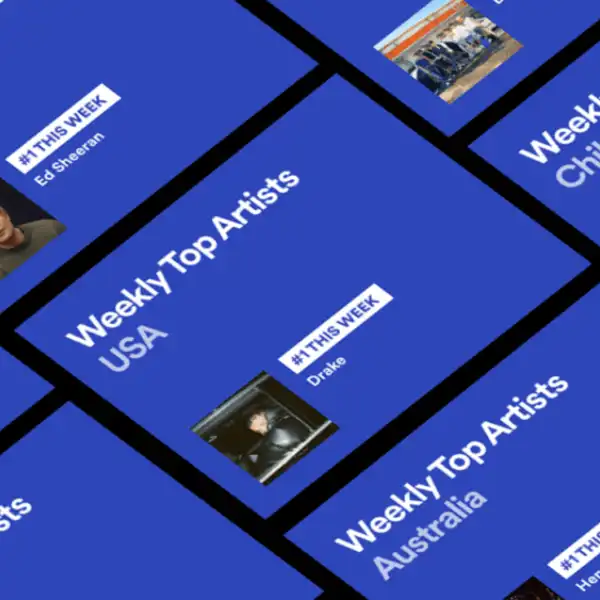
This event concerns which artist will hold the top position on the USA's weekly streaming chart for artists on a specific date in mid-June 2026.
Kalshi
Resolution is determined by Spotify's Weekly Top Artists USA chart dated June 11, 2026. The market resolves to Yes if the specified artist holds the #1 position on that chart according to Spotify's official rankings. Markets close at 8:25 AM ET on the expected release date and expire at the sooner of the first 10:00 AM ET following data release or one week after the expected release. This market is not endorsed by Spotify and references to Spotify charts are descriptive only.
Frequently asked questions
Prediction market odds on Kalshi reflect real-money bets from thousands of traders and differ from traditional analyst forecasts or music industry predictions. While analysts may rely on chart history, streaming data, and radio airplay trends, prediction markets aggregate dispersed information through price discovery. Market odds tend to update faster when new music releases, chart performance shifts, or cultural moments emerge. Comparing Kalshi probabilities to music publication rankings or industry expert predictions can reveal where the crowd sees value or disagreement relative to conventional wisdom about chart dominance.
On Kalshi, prices reflect that venue's order book, liquidity, and how traders price the outcome right now. On Kalshi, the Top Artist on Weekly Top Artists USA on Jun 11, 2026 is priced as a set of binary or multiple-choice outcomes, each representing a different artist. Traders buy or sell shares at prices between 0 and 100 cents, where the price reflects the market's implied probability that artist will rank first on the specified date. As new information emerges—chart movements, streaming surges, or cultural events—the price adjusts based on order flow and trader conviction. The current leading outcome and its probability are visible on the dashboard, along with volume and recent price history.
The market resolves on Jun 25, 2026. Resolution is determined by the official Weekly Top Artists USA chart data published for June 11, 2026. The artist ranked at position number one on that chart at the specified time becomes the winning outcome. Until that date, prices fluctuate based on trader expectations, new releases, streaming trends, and real-world events affecting chart performance. Traders can adjust positions throughout the event window as new information becomes available.
Major catalog releases, surprise album drops, or high-profile collaborations from leading contenders can shift odds significantly. Chart performance in the weeks immediately before June 11 directly influences expectations, as does streaming momentum and radio rotation. Cultural moments, award show performances, or viral social media trends can boost an artist's visibility and chart trajectory. Competitor activity matters too—if a frontrunner releases weaker material or faces controversy, alternatives gain ground. Music industry news, playlist placements on major platforms, and real-time chart data all serve as key signals traders monitor to adjust their positions.
