TOTAL VOLUME:
$134.2b
24H VOL:
$126,590,312
24H TRANSACTIONS:
2,388,728,490
OPEN INTEREST:
$1,439,516,703
404,175
Markets across
30,277
events
MATCHED EVENTS:
2,685
PLATFORM COVERAGE:
5
Polymarket:
39%
VS.
Kalshi:
61%
Drake
- Kalshi
Drake - Kalshi
1W
News
Positive
Negative
Neutral
Hover marker for details
Vol.
·
Resolved Jul 3, 2026
Latest in Entertainment


Closed: Jul 2, 11:59 PM EST

Kalshi
Description
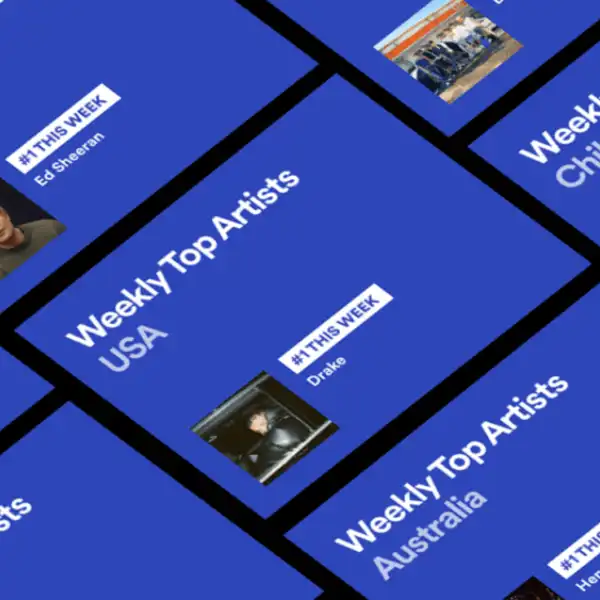
Spotify's Weekly Top Artists USA chart ranks the most-streamed artists in the United States based on listening activity. This market determines which artist will hold the #1 position on the chart dated July 2, 2026, reflecting the streaming preferences of American listeners during that week.
Kalshi
Resolution is determined by the artist occupying the #1 position on Spotify's Weekly Top Artists USA chart as of the chart dated July 2, 2026. The market resolves to Yes if any of the specified artists—Olivia Rodrigo, Drake, Morgan Wallen, Taylor Swift, Michael Jackson, Noah Kahan, Bad Bunny, Ariana Grande, Ella Langley, Kanye West, The Weeknd, Justin Bieber, Malcolm Todd, YoungBoy Never Broke Again, or Bruno Mars—holds the top ranking on that date. Only one artist can occupy the #1 position, so only one outcome will resolve affirmatively. This market is descriptive in nature and has not been endorsed by Spotify; references to Spotify charts and streaming data are informational only and do not indicate any affiliation between this market and Spotify.
Frequently asked questions
Prediction market odds often diverge from traditional music industry analyst forecasts because they aggregate real-time trader conviction rather than relying on static models or expert opinion. While analysts may project chart performance based on historical sales patterns and radio airplay, this market reflects dynamic expectations shaped by breaking news, surprise releases, and social momentum. Traders betting real capital tend to incorporate emerging signals—viral moments, playlist placements, and streaming surges—faster than periodic analyst updates. This makes the odds a complementary signal to published forecasts, capturing market-driven sentiment that conventional analysis may lag.
On Kalshi, this market is priced through a continuous order-book mechanism where traders buy and sell shares representing each artist's probability of topping the chart. On Kalshi, prices reflect that venue's order book, liquidity, and how traders price the outcome right now. Each share reflects the market's collective belief in that outcome, with prices ranging from near-zero to near-100 cents. As new information emerges—chart leaks, streaming data, or competing releases—traders adjust their positions, moving the price up or down. The bid-ask spread tightens as the resolution date approaches and conviction hardens around likely outcomes.
This market resolves around Jul 16, 2026, once the Weekly Top Artists USA chart for that week is officially published and verified. The outcome is determined by identifying which artist holds the number-one position on the chart as of that date. Resolution is confirmed against credible public reporting from the chart authority, ensuring accuracy and transparency. All positions settle based on the verified top artist, with winning traders receiving full payout and losing positions expiring worthless.
Major catalysts include surprise album or single releases from competing artists, unexpected streaming surges driven by viral moments or social media trends, and shifts in radio and playlist promotion strategies. Chart leaks or early data from industry insiders can trigger sharp repricing. Collaborations, award show performances, and celebrity endorsements also influence momentum. Additionally, competitor withdrawals or delays in anticipated releases can reshape the competitive landscape. Real-time streaming metrics and chart position updates in the weeks leading up to July 2, 2026, will provide concrete signals that traders monitor closely to adjust their positions.
