TOTAL VOLUME:
$116.8b
24H VOL:
$81,408,110
24H TRANSACTIONS:
1,362,287,844
OPEN INTEREST:
$1,158,719,757
338,335
Markets across
33,183
events
MATCHED EVENTS:
4,218
PLATFORM COVERAGE:
5
Polymarket:
42%
VS.
Kalshi:
58%
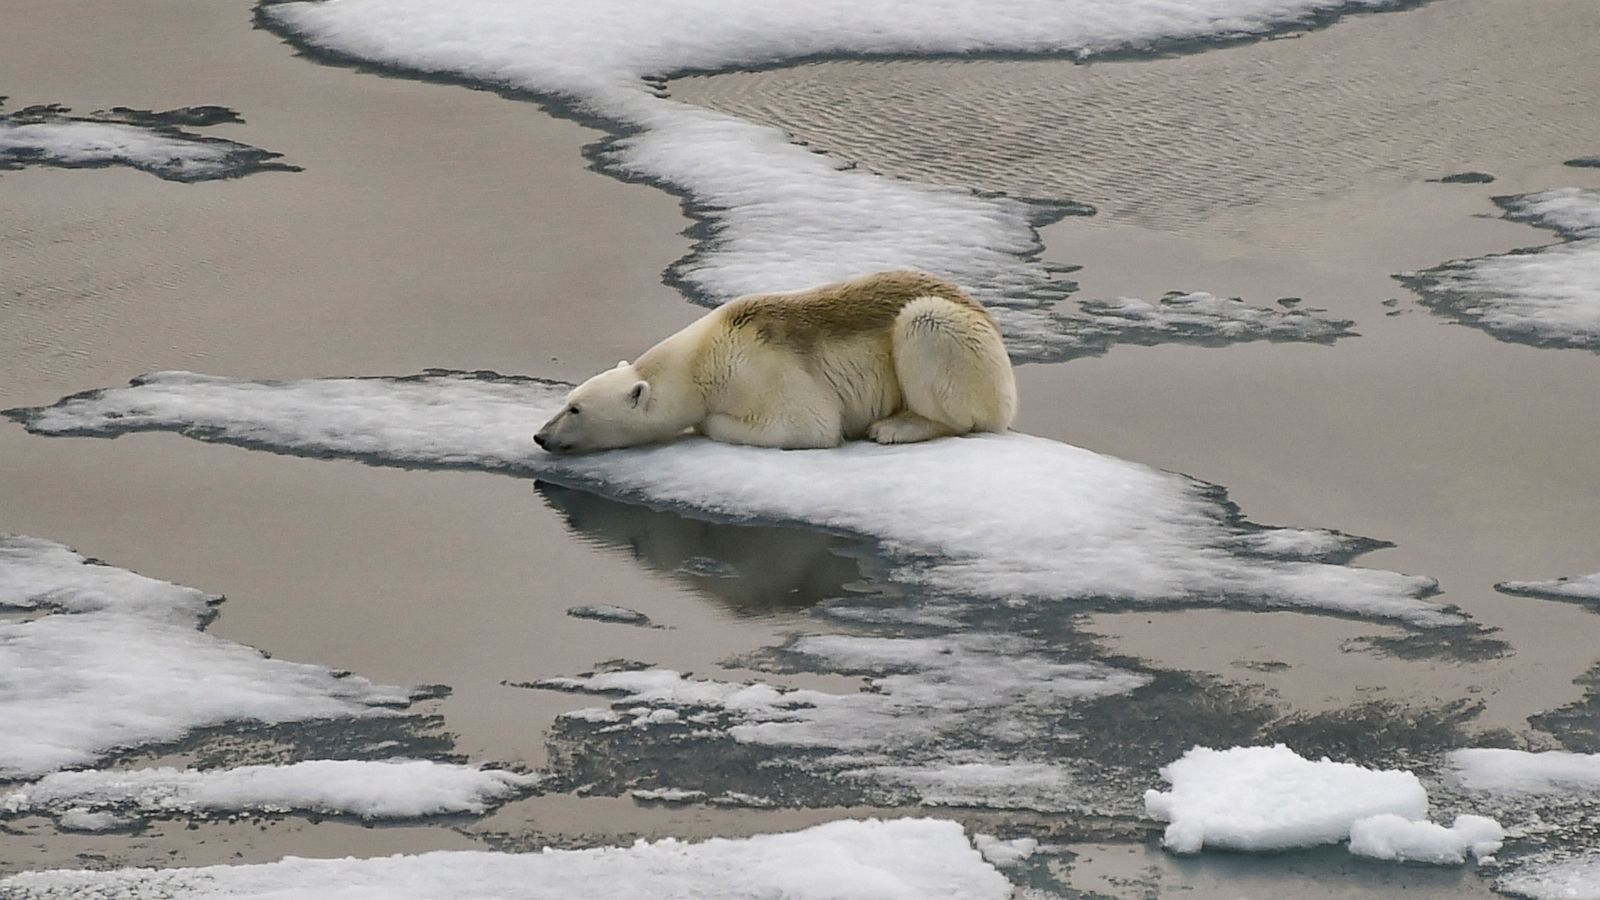


Min Arctic sea ice extent this summer?
Below 4.8 million sq km
- Kalshi
Below 4.8 million sq km - Kalshi
98%
1W
News
Positive
Negative
Neutral
Hover marker for details
Aug 20
Aug 21
Aug 22
Aug 23
Aug 24
Aug 26
Aug 27
Vol.
$185.9
·
Resolves Oct 2, 2026
Latest in Climate and Weather


Will the extent of the Arctic sea ice be below 4.8 million square km between December 19, 2025 and October 01, 2026?
$

Description
This event group concerns the minimum Arctic sea ice extent recorded during the summer of 2026. Markets across Polymarket and Kalshi will resolve based on data from the National Snow and Ice Data Center, but with differing timeframes and threshold definitions.
PredictionHero - Resolution Divergence Alerts (RDA)
Divergence Detected
Issue: Divergence in observation window and threshold definitionsHero tip: Focus trades on Polymarket for summer-specific bets; Kalshi markets may resolve earlier due to broader winter inclusionCritical divergence points:
- Polymarket: Resolves based on minimum extent recorded between August 1, 2026 and October 1, 2026 using NSIDC's NH-Daily-Extent data
- Kalshi: Resolves if any day between December 19, 2025 and October 1, 2026 records extent below specified thresholds
Polymarket
This market will resolve according to the minimum Arctic sea ice extent for all days between August 1, 2026 and October 1, 2026, as published by the National Snow and Ice Data Center. This market will remain open until data has been published for October 1, 2026, at which point it will resolve immediately. Any revisions to sea ice extent recorded after data is published for October 1, 2026 will not be considered. The resolution source for this market measures temperatures to thousands of square kilometers (e.g. 4.255 million sq km). Thus, this is the level of precision that will be used when resolving the market. The resolution source for this market will be information from the National Snow and Ice Data Center, specifically the minimum value recorded for any day between August 1, 2026 and October 1, 2026 in the “NH-Daily-Extent” tab of the “Sea Ice Index Daily Extent” data set, available at https://nsidc.org/sea-ice-today/sea-ice-tools. If this resolution source becomes unavailable, another resolution source will be chosen.
Kalshi
The event evaluates multiple thresholds for Arctic sea ice extent during the period from December 19, 2025, to October 1, 2026. Each threshold represents a specific level below which the sea ice extent must fall on at least one day for the corresponding market to resolve as Yes. The primary measurement source is the National Snow & Ice Data Center's (NSIDC) Sea Ice Index Version 4, specifically the Northern Hemisphere daily CSV data. The underlying data point for all markets is the lowest individual daily extent value recorded within the specified timeframe, measured in millions of square kilometers. The markets are structured around progressively lower thresholds, starting from 4.8 million square kilometers and descending to 3.6 million square kilometers. If the recorded extent on any day within the period falls below any of these thresholds, the respective market resolves to Yes. The secondary rule consistently defines the underlying data source and calculation method across all markets, ensuring uniformity in how the extent values are determined and reported.
Frequently asked questions
On Polymarket, this market is priced through trader sentiment and current data trends. Analyst forecasts for the Arctic sea ice extent market often incorporate long-term climate models and historical patterns, which can differ from short-term market pricing. While prediction markets reflect real-time betting activity and may shift rapidly with new data, analyst reports usually provide broader context and deeper scientific insights. The gap between these two can vary widely, especially as new observations emerge. Understanding both perspectives helps gauge uncertainty and potential market movements.
On Polymarket and Kalshi, prices can vary because of differences in user bases, liquidity, and market design. Polymarket and Kalshi can show different implied probabilities for the same outcome because of liquidity, fee structure, participant mix, and how each venue defines the contract. For instance, Polymarket currently favors Will the minimum Arctic sea ice extent this summer be between 4.4m & 4.6m square kilometers? at 34.2%, while Kalshi leans toward Will the extent of the Arctic sea ice be below 4.8 million square km between December 19, 2025 and October 01, 2026? at 92.0%. Such spreads of 57.8 percentage points are normal in markets with differing participation and risk profiles.
This market resolves around Oct 2, 2026, with the outcome confirmed once the event is verifiable from credible public reporting. The final determination will hinge on authoritative measurements of Arctic sea ice extent from trusted scientific sources, ensuring an objective and transparent close.
Several key signals could influence this market before Oct 2, 2026. Satellite updates showing unexpected melt or freeze rates will shift expectations quickly. Reports from polar research institutions, especially those indicating abrupt changes in ice thickness or area, often trigger sharp market moves. Weather anomalies such as prolonged storms or unusual solar activity can also impact outcomes. Additionally, large-scale climate policy announcements or international agreements may affect long-term trends and trader sentiment, potentially moving prices in either direction as the resolution date approaches.
'%3e%3ccircle%20cx='26'%20cy='26'%20r='26'%20fill='%23000'/%3e%3cpath%20fill='%23fff'%20d='M27.6629%2037.9855L31.004%2037.6925L32.1989%2051.3689C33.72%2051.027%2035.2073%2050.5486%2036.6425%2049.9395V37.8085H40.7697V47.7178C42.4942%2046.577%2044.0775%2045.236%2045.4865%2043.7226L46.0172%2037.6591L49.5548%2037.9678C51.5707%2034.0725%2052.5697%2029.7306%2052.4591%2025.3456C52.3484%2020.9605%2051.1317%2016.6746%2048.9219%2012.886L48.7903%2014.392L44.6631%2014.0303L45.1937%207.97067C43.8569%206.58147%2042.3706%205.34447%2040.7619%204.28222V14.2406H36.6347V2.06247C34.8743%201.313%2033.0358%200.762345%2031.1533%200.420753L32.3463%2014.0637L29.0052%2014.3566L27.7513%200.0314647C27.3308%200.0118035%2026.9062%200%2026.4817%200C24.8262%204.44017e-06%2023.1745%200.157349%2021.5487%200.469906L23.9072%2013.8985L21.364%2014.3468L19.0253%201.0853C16.8454%201.73668%2014.7611%202.67345%2012.8266%203.87129L15.4601%2013.7019L13.4634%2014.2387L11.0146%205.09226C9.12509%206.49278%207.43337%208.1422%205.98527%209.99577L7.26077%2013.5014L5.80446%2014.0322L4.88665%2011.5097C3.41845%2013.6953%202.29182%2016.092%201.54558%2018.6172L1.95829%2018.4678L7.2647%2033.0387L5.80839%2033.5696L1.06407%2020.5303C-0.0225105%2025.6016%200.430464%2030.8821%202.36486%2035.6941C4.29926%2040.5061%207.62683%2044.6301%2011.9206%2047.5369L9.45605%2038.3355L11.4528%2037.7987L14.4677%2049.0567C16.5333%2050.1354%2018.7355%2050.9291%2021.0142%2051.4161L18.6892%2038.1605L21.2343%2037.7122L23.7283%2051.8683C24.6462%2051.9654%2025.5686%2052.014%2026.4916%2052.0138C27.2954%2052.0138%2028.0933%2051.9764%2028.8795%2051.9037L27.6629%2037.9855Z'%20/%3e%3cpath%20fill='%23000'%20d='M46.0368%2018.1276L50.1542%2018.4875L48.804%2033.9372L44.6768%2033.5774L46.0368%2018.1276ZM36.6484%2018.279H40.7756V33.7858H36.6484V18.279ZM31.0099%2018.1611L32.3601%2033.6109L29.019%2033.9038L27.6668%2018.454L31.0099%2018.1611ZM13.481%2033.7898L9.4698%2018.8099L11.4666%2018.2751L15.4778%2033.2452L13.481%2033.7898ZM21.3817%2033.892L18.6892%2018.6211L21.2343%2018.1729L23.9248%2033.4418L21.3817%2033.892Z'%20/%3e%3c/g%3e%3c/svg%3e)
