TOTAL VOLUME:
$143b
24H VOL:
$111,424,783
24H TRANSACTIONS:
2,676,623,266
OPEN INTEREST:
$1,630,632,565
494,234
Markets across
37,330
events
MATCHED EVENTS:
2,871
PLATFORM COVERAGE:
5
Polymarket:
38%
VS.
Kalshi:
62%

4.0–5.0%
- Polymarket
4.0–5.0% - Polymarket
1W
News
Positive
Negative
Neutral
Hover marker for details
Vol.
·
Resolves Feb 1, 2027
Latest in Economics

Will China’s 2026 annual GDP growth (Y/Y) be between 4.0% and 5.0%?
$
Intro
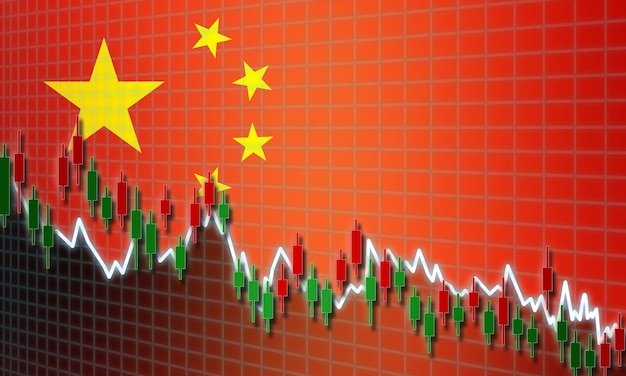
This market tracks whether China’s annual GDP growth in 2026 will fall between 4.0% and 5.0%. Currently, Polymarket gives this outcome a 92.5% probability, while the chance of growth between 5.0% and 6.0% is at 6.3%. Resolution will be based on China's Y/Y Growth Rate of Gross Domestic Product for the full year of 2026, as reported in the “Preliminary Accounting Results of GDP” release, available at https://www.stats.gov.cn/english/PressRelease/. Traders should closely watch for the release of this data sometime in January 2027, as the figures published then will determine the market’s outcome.
Polymarket
This market will resolve according to China's Y/Y Growth Rate of Gross Domestic Product (GDP) for the full year of 2026, as reported in the "Preliminary Accounting Results of GDP" release for the fourth quarter and full year of 2026, scheduled for some time in January, 2027. The relevant figure may be found in the table titled “Preliminary Accounting Results of GDP for the Fourth Quarter and Full Year of 2026” under “Growth Rate Y/Y (%)” in the row “GDP” and the column “Year 2026”. The annual GDP Y/Y growth rate will still be considered if China’s GDP reporting format changes. If the reported value falls exactly between two brackets, then this market will resolve to the higher range bracket. The GDP release will be made available here: https://www.stats.gov.cn/english/PressRelease/ If no figure for the full year 2026 Y/Y GDP growth rate is reported, this market will resolve according to the Y/Y growth rate for Q4 2026. If no data for the specified year and quarter is released by the date the next quarter's data is scheduled to be released, this market will resolve based on data from the last available quarter. Note: data from the initial release of the referenced GDP report is what will be used to resolve this market. Data may be revised during the following quarter or as a part of the next estimate's publication, however any revisions to GDP report data made after the initial release will not be considered for this market's resolution.
Frequently asked questions
Currently, prediction market participants are expressing views on China's 2026 GDP growth that may differ from traditional analyst forecasts. While many analysts predict a continued slowdown, this market reflects a range of expectations, with traders assigning probabilities to different growth scenarios. It's important to remember that prediction markets aggregate diverse perspectives and can sometimes offer insights that diverge from conventional wisdom. Comparing the implied probabilities in this market to the consensus estimates from economic polls and research reports can provide a more comprehensive understanding of potential outcomes.
This market resolves around Feb 1, 2027, with the outcome confirmed once the official annual GDP growth rate for China in 2026 is verifiable from credible public reporting. The resolution will be based on the year-over-year growth rate as reported by the National Bureau of Statistics of China or a similarly recognized official source. Traders will then be paid out based on whether their chosen outcome aligns with the verified growth rate. The market's outcome is determined by the official data release, not by any subjective interpretation or platform-specific criteria.
Several key signals and events could significantly impact this market. Major economic data releases from China, such as monthly industrial production figures or trade balances, will be closely watched. Geopolitical developments, including trade negotiations with the United States or changes in Chinese government policy, could also influence trader sentiment. Unexpected events like significant disruptions to global supply chains or major domestic policy shifts within China could also cause shifts in the market. Any news that alters perceptions of China's economic trajectory has the potential to move this market.

'%3e%3ccircle%20cx='26'%20cy='26'%20r='26'%20fill='%23000'/%3e%3cpath%20fill='%23fff'%20d='M27.6629%2037.9855L31.004%2037.6925L32.1989%2051.3689C33.72%2051.027%2035.2073%2050.5486%2036.6425%2049.9395V37.8085H40.7697V47.7178C42.4942%2046.577%2044.0775%2045.236%2045.4865%2043.7226L46.0172%2037.6591L49.5548%2037.9678C51.5707%2034.0725%2052.5697%2029.7306%2052.4591%2025.3456C52.3484%2020.9605%2051.1317%2016.6746%2048.9219%2012.886L48.7903%2014.392L44.6631%2014.0303L45.1937%207.97067C43.8569%206.58147%2042.3706%205.34447%2040.7619%204.28222V14.2406H36.6347V2.06247C34.8743%201.313%2033.0358%200.762345%2031.1533%200.420753L32.3463%2014.0637L29.0052%2014.3566L27.7513%200.0314647C27.3308%200.0118035%2026.9062%200%2026.4817%200C24.8262%204.44017e-06%2023.1745%200.157349%2021.5487%200.469906L23.9072%2013.8985L21.364%2014.3468L19.0253%201.0853C16.8454%201.73668%2014.7611%202.67345%2012.8266%203.87129L15.4601%2013.7019L13.4634%2014.2387L11.0146%205.09226C9.12509%206.49278%207.43337%208.1422%205.98527%209.99577L7.26077%2013.5014L5.80446%2014.0322L4.88665%2011.5097C3.41845%2013.6953%202.29182%2016.092%201.54558%2018.6172L1.95829%2018.4678L7.2647%2033.0387L5.80839%2033.5696L1.06407%2020.5303C-0.0225105%2025.6016%200.430464%2030.8821%202.36486%2035.6941C4.29926%2040.5061%207.62683%2044.6301%2011.9206%2047.5369L9.45605%2038.3355L11.4528%2037.7987L14.4677%2049.0567C16.5333%2050.1354%2018.7355%2050.9291%2021.0142%2051.4161L18.6892%2038.1605L21.2343%2037.7122L23.7283%2051.8683C24.6462%2051.9654%2025.5686%2052.014%2026.4916%2052.0138C27.2954%2052.0138%2028.0933%2051.9764%2028.8795%2051.9037L27.6629%2037.9855Z'%20/%3e%3cpath%20fill='%23000'%20d='M46.0368%2018.1276L50.1542%2018.4875L48.804%2033.9372L44.6768%2033.5774L46.0368%2018.1276ZM36.6484%2018.279H40.7756V33.7858H36.6484V18.279ZM31.0099%2018.1611L32.3601%2033.6109L29.019%2033.9038L27.6668%2018.454L31.0099%2018.1611ZM13.481%2033.7898L9.4698%2018.8099L11.4666%2018.2751L15.4778%2033.2452L13.481%2033.7898ZM21.3817%2033.892L18.6892%2018.6211L21.2343%2018.1729L23.9248%2033.4418L21.3817%2033.892Z'%20/%3e%3c/g%3e%3c/svg%3e)

%20scale(0.82)%20translate(-12.5%20-12.5)'%3e%3cpath%20fill='%23000'%20fill-rule='evenodd'%20d='M9.619%2012.69h12.995a1.382%201.382%200%200%200%200-2.76h-3.932l5.298-5.405.032-.032L22.08%202.56h-5.255V1.38c0-.76-.619-1.38-1.38-1.38H9.81c-.76%200-1.38.62-1.38%201.38V11.5c0%20.657.534%201.19%201.19%201.19m12.995-2.186h-5.3l5.89-6.01-1.139-1.139-5.813%205.933V1.38a.806.806%200%200%200-.805-.806.806.806%200%200%200-.805.806v9.545c0%20.656.533%201.19%201.189%201.19h6.783a.806.806%200%200%200%200-1.612'%20clip-rule='evenodd'/%3e%3cpath%20fill='%23000'%20fill-rule='evenodd'%20d='M14.393%2011.31H1.398a1.382%201.382%200%200%200%200%202.76H5.33L.032%2019.476%200%2019.507l1.931%201.933h5.255v1.18c0%20.76.619%201.38%201.379%201.38h5.638c.76%200%201.38-.62%201.38-1.38V12.5c0-.657-.534-1.19-1.19-1.19m.293%2011.31a.8.8%200%200%201-.788.805.797.797%200%200%201-.787-.805v-7.904l-5.69%205.928-1.113-1.139%205.764-6.005H6.884a.797.797%200%200%201-.787-.806c0-.444.353-.806.787-.806h6.638c.642%200%201.164.534%201.164%201.19z'%20clip-rule='evenodd'/%3e%3c/g%3e%3c/svg%3e)