TOTAL VOLUME:
$92.8b
24H VOL:
$205,092,926
24H TRANSACTIONS:
886,030,093
OPEN INTEREST:
$2,033,292,662
780,780
Markets across
13,842
events
MATCHED EVENTS:
872
PLATFORM COVERAGE:
5
Polymarket:
46%
VS.
Kalshi:
54%
Which states will experience exceptional drought? (6/4 - 7/30)? Odds & Prediction Markets


Time left: 28d:07h:10m
Will Oregon have a maximum drought category of at least D4 during June 4–July 30, 2026?
$
$20
$50
$100
$500
Intro
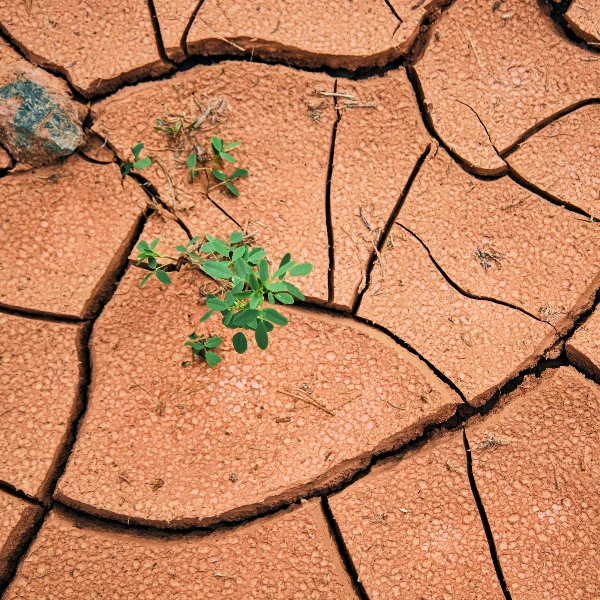
This market tracks whether severe drought conditions will reach D4 category or worse on the U.S. Drought Monitor across fifteen specified states during the summer period of June 4–July 30, 2026. On Kalshi, the leading outcome—whether North Carolina will experience maximum drought category of at least D4 during this window—stands at 71.0%. The market resolves based on U.S. Drought Monitor data published for the specified period. Watch the weekly Drought Monitor updates throughout June and July 2026 to gauge whether conditions intensify toward D4 classification in tracked regions.
Kalshi
Each state is evaluated independently based on the maximum drought monitor category reached during June 4–July 30, 2026. A state resolves to Yes if its peak drought classification reaches D4 (exceptional drought) or higher at any point during the observation window. The assessment uses official US Drought Monitor data, which is updated weekly and reflects current conditions based on precipitation, soil moisture, streamflow, and other hydrological indicators. Multiple states may simultaneously experience exceptional drought, and each state's outcome is determined solely by whether that state individually reaches the D4 threshold.
Frequently asked questions
Prediction market odds on Kalshi reflect real-money trader expectations and often diverge from traditional seasonal drought forecasts issued by NOAA, the U.S. Drought Monitor, and climate research institutions. While meteorological models rely on historical climate data and atmospheric patterns, prediction markets incorporate broader information including recent precipitation trends, soil moisture reports, and trader sentiment. Comparing Kalshi implied probabilities to published drought outlooks reveals whether markets are pricing in more or less severe conditions than official forecasters expect for the June–July period.
On Kalshi, drought outcomes are priced as binary contracts tied to specific states and drought categories. On Kalshi, prices reflect that venue's order book, liquidity, and how traders price the outcome right now. The top outcome—Will Oregon have a maximum drought category of at least D4 during June 4–July 30, 2026?—is currently trading at 63.0% implied probability. Each state-category pair trades independently, allowing traders to isolate exposure to particular regions. Prices update continuously as new weather data, precipitation forecasts, and trader positions flow in, reflecting the market's collective assessment of drought severity risk through the event window.
The market resolves on Aug 7, 2026. Resolution is determined by observed drought conditions across specified U.S. states during the June 4 through July 30, 2026 observation period. Outcomes are tied to official drought classifications and monitoring data collected during that window. Traders should monitor drought indices, precipitation reports, and official drought declarations as the event window progresses to assess the likelihood of each state reaching the specified drought severity threshold.
Key drivers include weekly U.S. Drought Monitor updates, NOAA precipitation forecasts, soil moisture readings, and regional weather patterns during June and July 2026. Sustained heat waves, below-average rainfall, water supply reports, and agricultural stress indicators will influence trader expectations. Early-season drought declarations, reservoir levels, and snowpack depletion in western states are critical catalysts. Real-time weather developments and seasonal climate outlooks released closer to the event window will likely trigger significant price adjustments as traders reassess the probability of exceptional drought conditions materializing.

'%3e%3ccircle%20cx='26'%20cy='26'%20r='26'%20fill='%23000'/%3e%3cpath%20fill='%23fff'%20d='M27.6629%2037.9855L31.004%2037.6925L32.1989%2051.3689C33.72%2051.027%2035.2073%2050.5486%2036.6425%2049.9395V37.8085H40.7697V47.7178C42.4942%2046.577%2044.0775%2045.236%2045.4865%2043.7226L46.0172%2037.6591L49.5548%2037.9678C51.5707%2034.0725%2052.5697%2029.7306%2052.4591%2025.3456C52.3484%2020.9605%2051.1317%2016.6746%2048.9219%2012.886L48.7903%2014.392L44.6631%2014.0303L45.1937%207.97067C43.8569%206.58147%2042.3706%205.34447%2040.7619%204.28222V14.2406H36.6347V2.06247C34.8743%201.313%2033.0358%200.762345%2031.1533%200.420753L32.3463%2014.0637L29.0052%2014.3566L27.7513%200.0314647C27.3308%200.0118035%2026.9062%200%2026.4817%200C24.8262%204.44017e-06%2023.1745%200.157349%2021.5487%200.469906L23.9072%2013.8985L21.364%2014.3468L19.0253%201.0853C16.8454%201.73668%2014.7611%202.67345%2012.8266%203.87129L15.4601%2013.7019L13.4634%2014.2387L11.0146%205.09226C9.12509%206.49278%207.43337%208.1422%205.98527%209.99577L7.26077%2013.5014L5.80446%2014.0322L4.88665%2011.5097C3.41845%2013.6953%202.29182%2016.092%201.54558%2018.6172L1.95829%2018.4678L7.2647%2033.0387L5.80839%2033.5696L1.06407%2020.5303C-0.0225105%2025.6016%200.430464%2030.8821%202.36486%2035.6941C4.29926%2040.5061%207.62683%2044.6301%2011.9206%2047.5369L9.45605%2038.3355L11.4528%2037.7987L14.4677%2049.0567C16.5333%2050.1354%2018.7355%2050.9291%2021.0142%2051.4161L18.6892%2038.1605L21.2343%2037.7122L23.7283%2051.8683C24.6462%2051.9654%2025.5686%2052.014%2026.4916%2052.0138C27.2954%2052.0138%2028.0933%2051.9764%2028.8795%2051.9037L27.6629%2037.9855Z'%20/%3e%3cpath%20fill='%23000'%20d='M46.0368%2018.1276L50.1542%2018.4875L48.804%2033.9372L44.6768%2033.5774L46.0368%2018.1276ZM36.6484%2018.279H40.7756V33.7858H36.6484V18.279ZM31.0099%2018.1611L32.3601%2033.6109L29.019%2033.9038L27.6668%2018.454L31.0099%2018.1611ZM13.481%2033.7898L9.4698%2018.8099L11.4666%2018.2751L15.4778%2033.2452L13.481%2033.7898ZM21.3817%2033.892L18.6892%2018.6211L21.2343%2018.1729L23.9248%2033.4418L21.3817%2033.892Z'%20/%3e%3c/g%3e%3c/svg%3e)
Follow the signals, not the noise
Get insights on market conviction, notable shifts, and what the data is quietly signaling.